Scaling to 10-Minute Delivery: How to Maintain Elite SLAs Without Drowning in Dead Inventory

This narrative is for you if you are planning or currently expanding into Quick Commerce (Q-commerce) or if you are struggling to maintain Same-Day/10-Minute delivery promises.

This is a deep dive into why traditional safety stock models fail in high-velocity environments and a step-by-step breakdown of how a “Continuous Intelligence Layer” transforms stagnant inventory into capital velocity without requiring an expensive ERP overhaul.

A 5:30 PM Logistics Meltdown

The air in the “Command Center” was thick with the silent vibration of server fans and the bitter smell of over-extracted espresso. Outside, a flash thunderstorm had just turned the city streets into a gridlocked nightmare. 

In 2026, a storm isn’t just weather; it’s a high-stakes logistics catastrophe for any brand promising speed.

Let’s get real about who’s on the front lines, no more hiding behind job titles.

VP of Operation
Senior Demand Planer

The tension peaked as the monitors began to pulse red. “Linda, report,” Marcus barked.

“Demand for waterproof gear just spiked 500% downtown,” Linda replied, her voice tight. “But the system is showing ‘Zero’ on-hand at Leo’s store. We have the stock, it’s just stuck in the suburbs where it’s not even raining yet.”

Managing a Store

Leo appeared on the video link, frazzled. “Marcus, I’ve got enough laundry detergent here to wash the whole city, but I haven’t seen an umbrella in days. I’m out of shelf space, and my riders are sitting idle because I have nothing for them to deliver.”

Why “Buffer Stock” is a 2015 Solution for a 2026 Problem
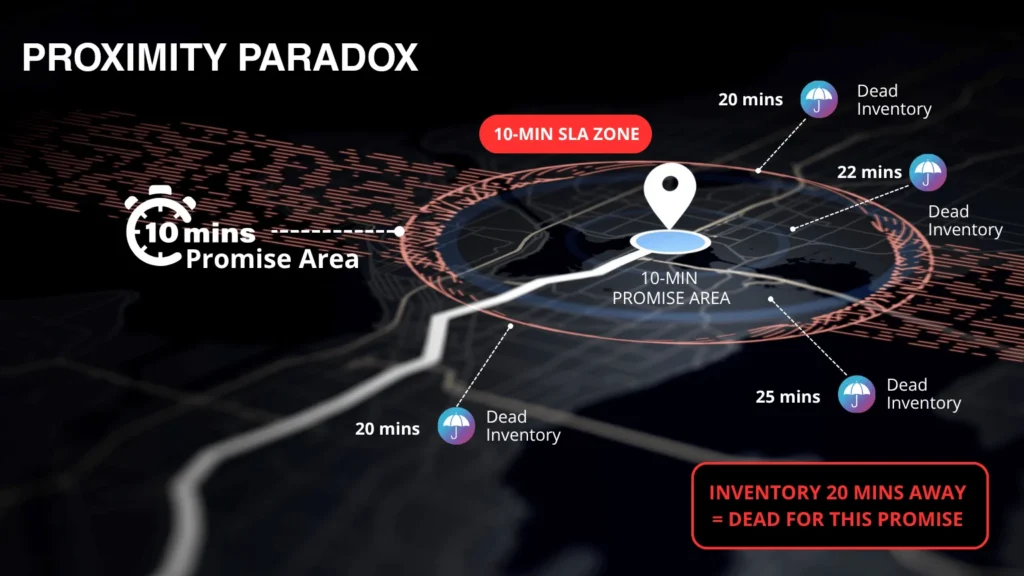
Proximity-Paradox

In this scenario, the brand is suffering from the Proximity Paradox. They have plenty of inventory, but it is “dead” because it is 20 minutes away from a 10-minute promise. Most brands try to solve this by increasing “Safety Stock”, stuffing every local hub to the gills just to survive the next hour.

But what if, instead of adding more “weight” to the shelves, they added a layer of intelligence?

It’s Not Magic, It’s Math: The SKU-Location Pulse

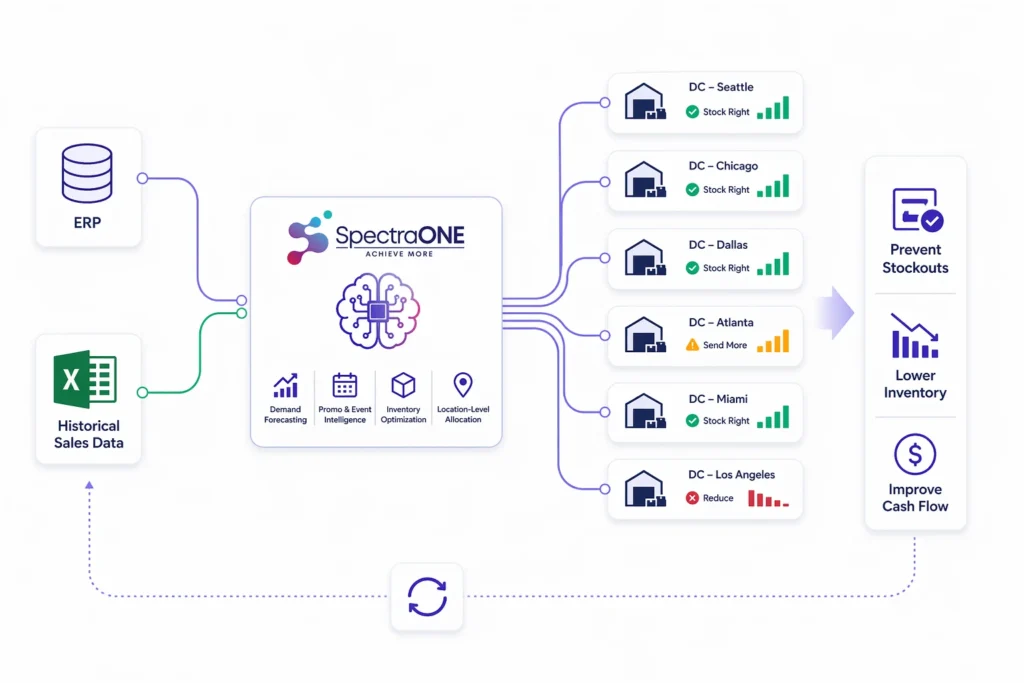
If an intelligence layer like SpectraONE were introduced into this “War Room,” the first change wouldn’t be a new warehouse; it would be a shift in the mathematics of replenishment. Traditional tools use “Averages” to calculate what a region needs over a month. But 10-minute delivery requires SKU-Location Demand Elasticity. This is the math of understanding how demand “bends” based on hyper-local signals. 

The engine doesn’t ask, “How much do we need in the city?” 

SpectraONE asks, What is the probability of a sale at Node #14 specifically between 5:00 PM and 7:00 PM on a rainy Tuesday?

Turning “Signals” into Flow

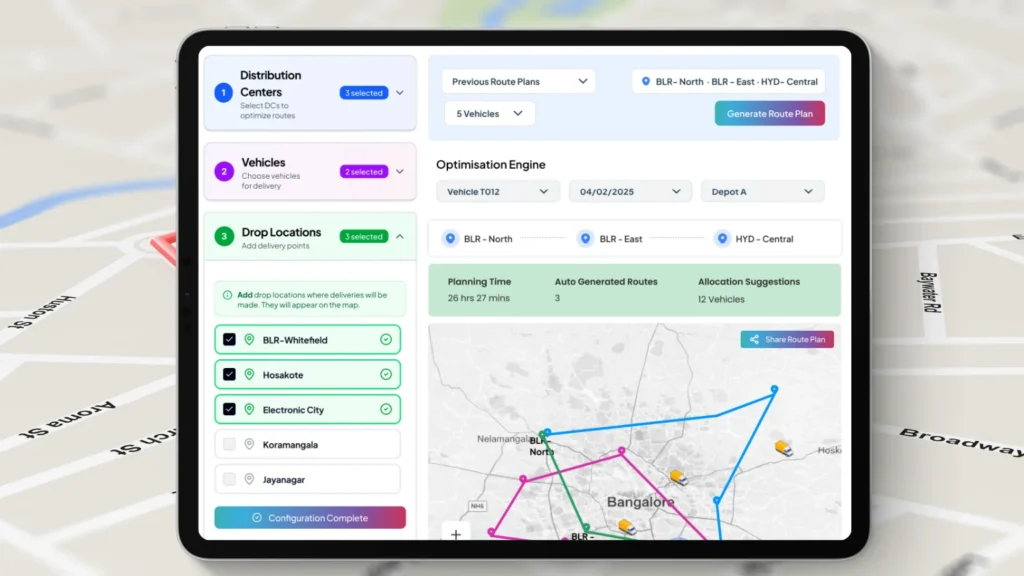
By ingesting Multi-Source Transactional Signals, real-time weather fronts, local traffic patterns, and even social sentiment, the engine identifies “Trapped Capital.” It would see the umbrellas in the suburbs and the laundry detergent downtown as “misallocated assets.” It doesn’t wait for a human to notice; it calculates the “Pulse” and triggers a Pre-emptive Rebalance hours before the storm hits.

Improving Workflow Without Disturbance

Improving Workflow Without Disturbance

The biggest fear in the supply chain is the “Total System Transplant.” Leaders stay away from AI because they assume it will break their daily operations. 

However, a true intelligence layer like SpectraONE works through a “Digital Handshake.” It doesn’t replace the existing ERP; it plugs into the data streams (POS, WMS, ERP) via API.

How it changes the daily routine:

  • No Manual Entry, the engine learns quietly in the background.
  • Recommendation vs. Reaction, instead of Linda spending six hours in Excel trying to find out where the stock is, she arrives at her desk to find three “Recommended Actions.” She clicks “Approve,” and the mid-mile transfers are triggered automatically.
  • The 48-Hour Diagnostic means onboarding doesn’t take months. Within two days, the engine can map every “Invisible Leak” in the current network, showing the team exactly where their cash is stuck.

The Long-Term AI Benefit

Why is this needed now? Because in 2026, the “Bullwhip Effect” (where small changes in demand cause massive inventory swings) is moving faster than human spreadsheets can follow. AI doesn’t replace the team; it promotes them.

  1. Reclaiming Time

When the engine handles 80% of routine replenishment, Linda and Marcus stop being “firefighters.” They finally have time to focus on vendor negotiations, new product launches, and strategic expansion.

  1. Long-Term Predictability

Over time, the AI learns the “DNA” of the brand’s demand. It predicts seasonal shifts months ahead, so capital is never “frozen” in safety stock that won’t move.

Why Brands Wait (and Why They Shouldn’t)

Many companies stay away from these shifts because they are waiting for a “Magic Update” from their legacy systems. They believe that their 2015-era ERP or other tools will eventually “add AI” that fixes everything. You have to accept:

Legacy systems are built for “Recording,” not “Deciding.” Adding AI to an old ERP is like putting a jet engine on a horse-drawn carriage. It wasn’t built for the “Continuous Intelligence” required for 10-minute SLAs.

“Perfect Data” is a myth. Brands wait to “clean their data” before trying AI. But advanced engines like SpectraONE are designed to find patterns within the mess. They are the filter that cleans the data.

A few Truths for the Decisive Leader

  • Your safety stock is not a “Security Blanket”; it is a graveyard for your cash flow.
  • A 99% fulfillment rate is a failure if it requires 20% excess inventory to achieve it.
  • Visibility is just “looking at the fire.” Decision Intelligence is “preventing the spark.”

The “Ghost” in the dark store, that dead inventory that kills your GMROI, isn’t a mystery; It’s just bad math. The question is no longer whether the technology exists to fix it; the question is how much longer you can afford to pay the “Invisible Tax” of staying static.
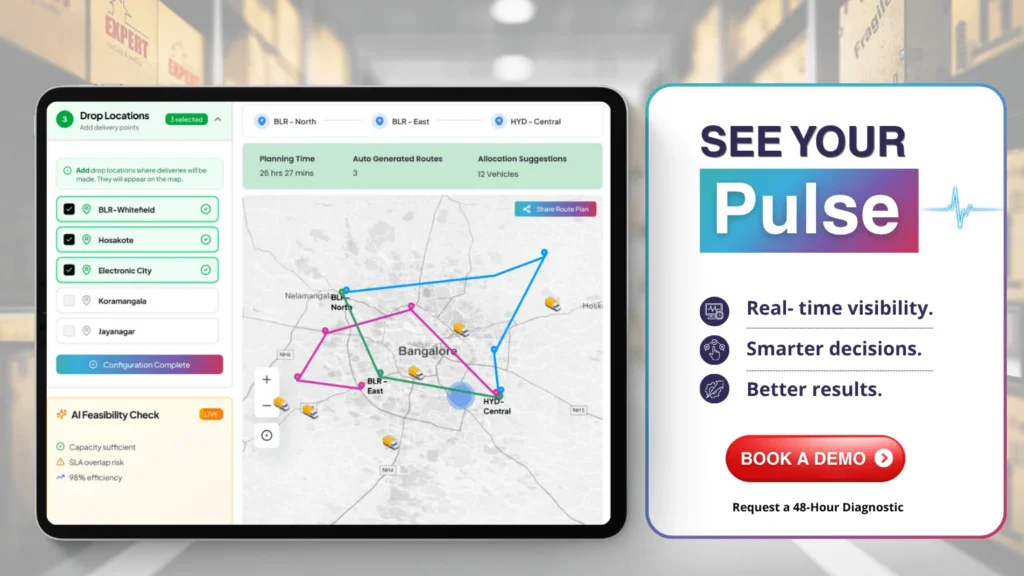

book-a-demo

How One Planner Stopped Reacting and Started Deciding: A Memorial Day Demand Story

At the Austin, Texas headquarters of a rapidly growing functional beverage brand, three distinct worlds were about to collide over one Memorial Day promotion.

Meet Chloe, the company’s Demand Planning Manager.

chloe

Chloe was the engine room of the supply chain. She was responsible for keeping roughly 800 SKUs moving smoothly across regional grocery chains, Amazon, and their booming direct-to-consumer (D2C) subscription website.

Next, meet Tom, the Director of Sales.

Tom

Tom was a high-energy growth driver whose primary metric was revenue. To Tom, if a product wasn’t on the shelf or available online, it was a lost opportunity.

And now meet Sarah, the VP of Operations. 

sarah

Sarah held the company’s checkbook. Her job was to protect profitability and cash flow, ensuring the company didn’t tie up precious working capital in piles of unsold inventory.

Preparation for a major holiday promotion

On a Tuesday morning in April, with Memorial Day weekend fast approaching, the unofficial start of summer and a massive sales driver for the beverage industry, the annual cross-functional tension at the company reached its peak.

Tom walked into Chloe’s office, riding a wave of excitement. “Chloe, I just locked in a massive promotional end-cap display with a major regional grocer for the holiday weekend, plus a targeted influencer campaign for our D2C site. I need you to bump the forecast up by at least 35% across all SKUs for that region. We cannot leave revenue on the table!”

Chloe pulled up her historical data, sighing as her laptop’s processor struggled to load the massive file. “Tom, increasing the forecast by a blanket 35% is exactly how we ended up with $150,000 in dead stock sitting in our Dallas warehouse last quarter.”

warehouse

Sarah, overhearing the conversation, stepped in. “Tom is right that we need to capture the revenue, but Chloe is right about the risk,” Sarah noted. “Our cost of capital is at a multi-decade high. If we just blindly flood our distribution nodes with inventory to satisfy a gut-feeling forecast, we are freezing cash that we desperately need for marketing next quarter. We need precision, not guesses.”

The Expectation vs. The Reality

Chloe was caught directly in the middle. Tom wanted zero stockouts; Sarah wanted lean working capital. 

A quick question for you: How do you handle these high-stakes promotional requests in your own business? Do you rely on gut feelings, or do you have a hard formula you stick to?

Let’s go back to the story:

Because Chloe’s only tool for bridging these two demands was a massive Excel file layered on top of a basic ERP system. Her workflow wasn’t actually planning; it was reacting. She spent her days reacting to Tom’s sales targets, reacting to missing data from the ERP, and manually typing in overrides to make the numbers look realistic.
Let’s be honest about the classic gridlock that mid-sized consumer goods brands face every day. 
The ExpectationThe Reality
If we study past spreadsheets and manually add a growth factor, we are making a sound inventory decision.Planners spend up to 80% of their time cleaning data and responding to manual errors, rather than making decisions. Spreadsheets simply cannot isolate true incremental demand from anomalies.

What is your plan for this year to move away from static spreadsheets? Are you planning to stick with Excel for another cycle, or are you looking for a cleaner way to operate? To understand more about the specific math failures behind why manual plans break down, you can read our breakdown on Why Your Forecasts Break Down During Promotions.

In fact, supply chain benchmarks show that planners relying on manual spreadsheet overrides are forced into a state of continuous crisis management. Have you noticed your team spending more time putting out daily fires than looking at long-term strategy?

Shifting from Reacting to Deciding

Later that afternoon, the trio sat down to look at the numbers again. 

Sitting together

Chloe pointed out that trying to predict demand for 800 SKUs across multiple channels and locations on a monthly or even bi-weekly cycle was physically impossible for a single planner using manual tools.

To solve the tug-of-war between Sales and Operations, Chloe knew they needed to stop acting like historians and start acting like executives. They didn’t need a bigger spreadsheet; they needed a system that allowed them to decide on strategy, rather than react to data.

What do you think? What if you didn’t have to guess?

Now, imagine a different scenario for Chloe’s team. Instead of spending 15 hours a week manually overriding cells, a dedicated system steps in to do the heavy lifting. Imagine an intelligent layer like SpectraONE connecting directly to your basic ERP and historical sales data.

SpectraONE

Instead of your team guessing the promotional lift, a transformer-based Demand Forecasting engine automatically ingests the promotional calendar. It calculates the expected lift at the specific SKU and location level, isolating baseline demand from true incremental growth. 

It knows exactly which distribution centers need the stock and which don’t, mapping demand precisely to prevent localized stockouts without bloating your company’s total inventory footprint. To see why this level of detail is critical for your multi-channel network, read our breakdown on Why SKU-Location Forecasting Matters.

Simultaneously, a Smart Inventory module automatically adjusts safety stock levels based on real-time lead times and volatility. It doesn’t use a blanket rule; it uses math.

The New Normal for Planners

In this new reality, Chloe doesn’t spend her Tuesday morning panicking over broken spreadsheet formulas. Instead, she opens a dashboard that presents her with system-generated replenishment suggestions.

The system says: “To support the Memorial Day promotion and maintain a 98% service level without violating working capital constraints, approve this purchase order for 12,000 units.” Chloe reviews the logic, clicks “Approve,” and spends the rest of her day reviewing the long-term network strategy. Tom gets his product on the shelves, Sarah keeps her capital free, and Chloe transitions from a reactive data-handler to a proactive decision-maker.

By moving away from static, reactive planning, mid-sized brands don’t just survive peak seasons; they master them. Let’s be honest, how long does it take your team to prep for a major holiday promotion? If your team is stuck in the middle of the growth vs. cost tug-of-war, it might be time to move away from the spreadsheets.

To see exactly how a continuous intelligence layer can transform your planning process, you can explore what a risk-free evaluation looks like by reading about our 14-Day Assisted Trial. If you have any questions about how this would look with your specific SKU setup, please reach out to our team.

The SpectraONE 14-Day KPI Challenge enables you to select one KPI (Inventory Turns, Forecast Accuracy, Stockout Rate), run a structured 14-day signal analysis, and measure whether earlier visibility reduces buffer dependence.


No system replacement | No integration risk | No workflow disruption.

Book a Live Demo and let’s map out a solution together.

From Reacting to Deciding: How FMCG Planners Can Escape Excel Firefighting in APAC

If you speak to most FMCG planners today, one phrase comes up again and again—“We’re constantly firefighting.”

A sudden spike in demand, a promotion that didn’t go as planned, or a stockout that no one saw coming. And more often than not, the root cause traces back to one thing: spreadsheets.

Across APAC, where markets are fast-moving and unpredictable, relying on Excel for planning is becoming a serious limitation. According to industry reports, companies relying on manual planning methods experience 20–30% higher forecast errors.To stay ahead, companies need to rethink how they approach demand forecasting in FMCG.

The Reality of FMCG Planning in APAC

a (4)

APAC contributes to nearly 40% of global FMCG growth, driven by rapid urbanization, e-commerce expansion, and changing consumer behavior.

For planners, this means:

  • Managing hundreds (sometimes thousands) of SKUs
  • Handling demand across multiple channels
  • Planning around frequent promotions
  • Reacting to sudden demand changes

Accurate demand forecasting in FMCG becomes critical in such environments.

Why Excel Is No Longer Enough

a (1)

Spreadsheets have been the backbone of planning for years. They’re familiar, flexible, and easy to start with. But they weren’t built for today’s supply chains.

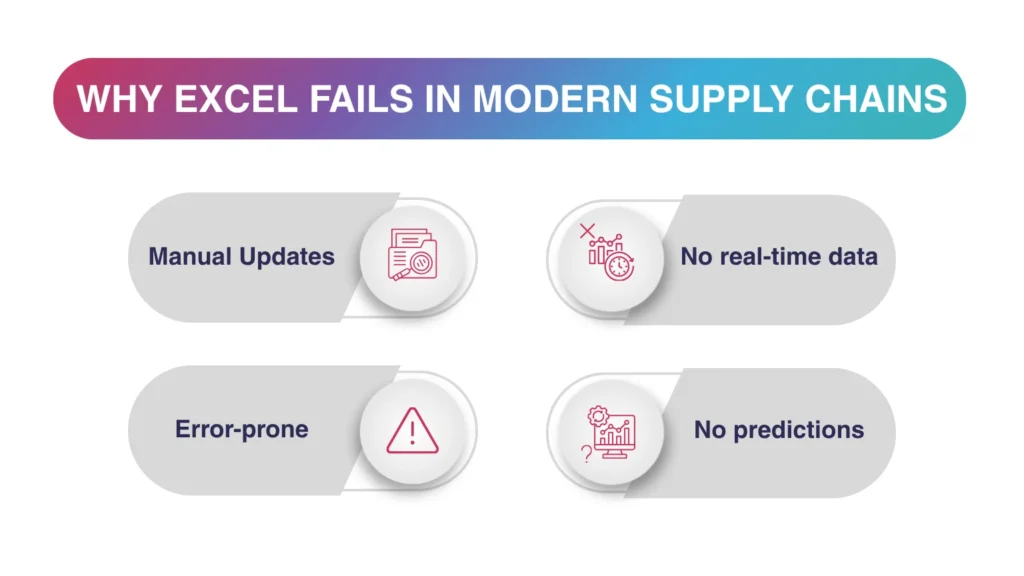
The limitations of Excel in supply chain planning are becoming harder to ignore:

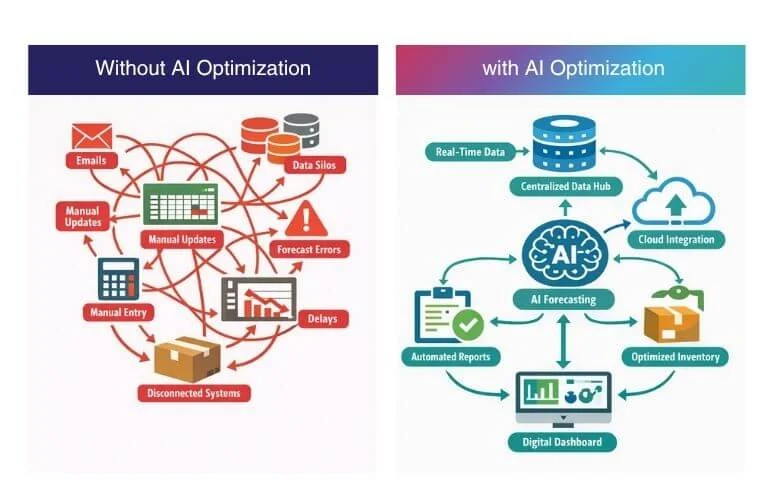
  • Data is scattered across systems and manually updated
  • Version control becomes messy with multiple stakeholders
  • Errors creep in without visibility
  • There’s no real way to predict what’s coming next

These manual demand forecasting issues force teams into reactive workflows and limit the effectiveness of demand forecasting in FMCG.

The Hidden Cost of Firefighting

Firefighting might feel like part of the job, but it comes at a cost.

Studies show that poor forecasting can increase inventory costs by up to 25%, while stockouts can lead to 5–10% lost sales annually.

  • Stockouts during high-demand periods
  • Excess inventory sitting in warehouses
  • Increased logistics and operational expenses
  • Lost sales and unhappy customers

These are common supply chain inefficiencies across FMCG operations.

Moving Toward Smarter Forecasting

a (3)

To break this cycle, FMCG companies need to move from reactive planning to proactive decision-making.

Organizations adopting AI-driven planning report 15–30% improvement in forecast accuracy and up to 20% reduction in inventory levels.

This is where modern demand forecasting software starts to make a real difference. Instead of relying only on historical data, these tools continuously analyze patterns, demand signals, and operational data.

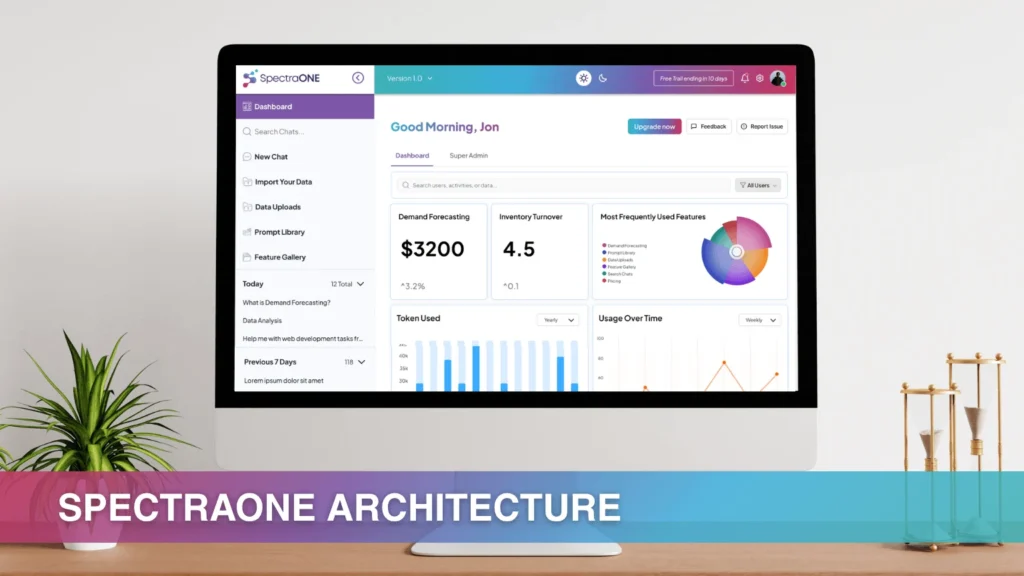
Platforms like SpectraONE act as an intelligence layer across the supply chain by connecting data from sales, inventory, and operations. This enables real-time visibility, early demand signal detection, and more accurate demand forecasting in FMCG.

How to Improve Demand Forecasting Accuracy

Improving accuracy doesn’t happen overnight, but a few changes can make a big impact.

Adopting the right demand forecasting software helps strengthen demand forecasting in FMCG and improve responsiveness.

From Firefighting to Decision-Making

With intelligent demand forecasting software, planners can:

  • Spot demand changes early
  • Reduce stockouts and excess inventory
  • Plan promotions more effectively
  • Improve overall supply chain efficiency

Real-World Example

A mid-sized FMCG company in Southeast Asia was managing planning through spreadsheets across multiple markets.

  • Frequent stockouts during promotions
  • Excess inventory in low-performing regions
  • Limited visibility across channels

After moving away from spreadsheet-based planning:

  • Forecast accuracy improved by ~25%
  • Stockouts reduced during peak demand
  • Inventory holding costs decreased

How SpectraONE Helps FMCG Teams

a (2)

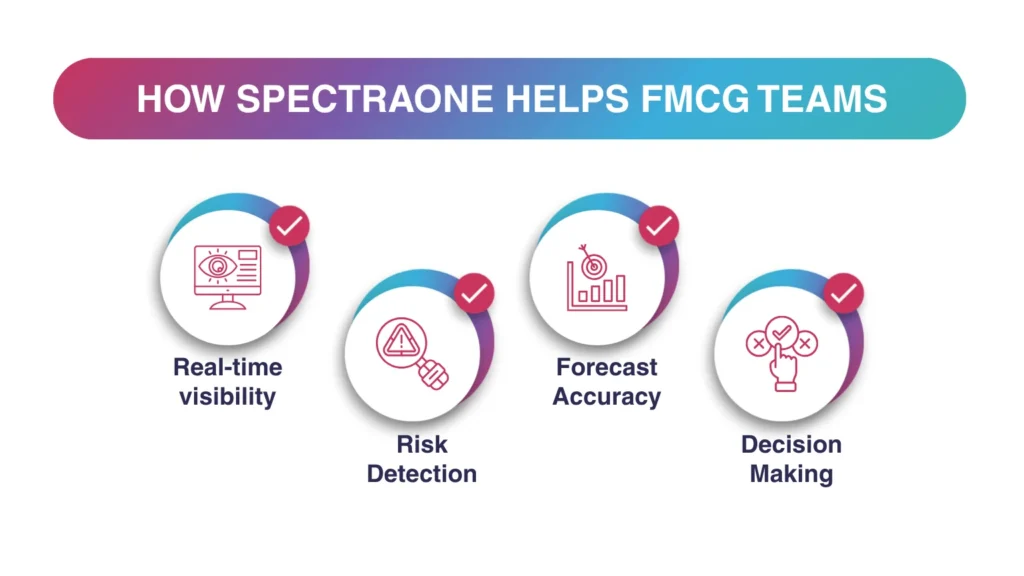
SpectraONE helps FMCG companies move beyond reactive planning by enabling:

  • Real-time visibility across demand, inventory, and supply
  • Early detection of demand fluctuations and risks
  • Continuous improvement in forecast accuracy
  • Faster, data-driven decision-making

Take the Next Step

If you’re still relying on spreadsheets, it’s worth evaluating the impact on your planning process.

  •  Use the ROI Calculator to estimate how much value you can unlock with platforms like SpectraONE

Final Thoughts

FMCG planning in APAC requires a shift toward smarter, data-driven approaches.By addressing the limitations of Excel in the supply chain, reducing manual demand forecasting issues, and minimizing supply chain inefficiencies, organizations can improve demand forecasting in FMCG and make better decisions.

The 2026 Bullwhip: Why Agentic AI is the Final “Shock Absorber” for Supply Chains

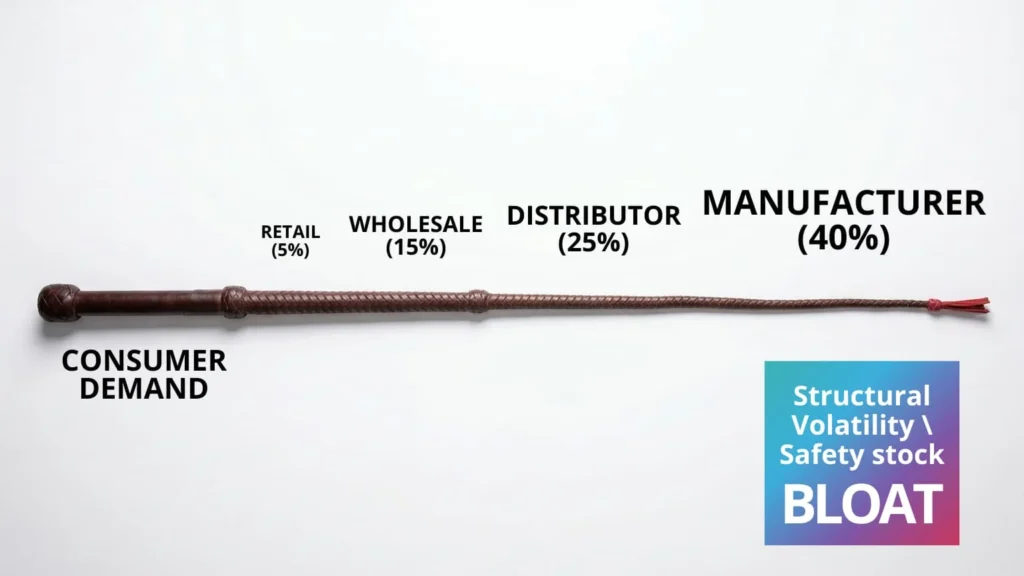
In supply chain circles, the “Bullwhip Effect” is often treated like the weather, something we talk about constantly but assume we cannot control. Historically, a 5% swing in retail demand has reliably translated into a 40% panic at the manufacturing plant.

1

Despite the digital transformation of the 2010s, this phenomenon has only intensified in 2026 as consumer behavior becomes more fragmented across social and digital channels.

At SpectraONE, we have observed that while companies have better data than ever, the bullwhip is actually a reasoning problem, not just a data problem. Here is how we are using LLM-based Agentic AI to finally dampen the whip.

The “Information Echo” Problem

The bullwhip effect is essentially a global game of “telephone.” Let’s understand this with an example.

Imagine a viral social media trend suddenly triples the demand for a specific oat milk brand in the US Midwest.

The 2026 Bullwhip Why Agentic AI is the Final Shock Absor- Blog

To a local grocer, it’s a one-week stockout. But as that signal travels upstream (unverified and lacking context) the distributor 2X their safety stock, and the processing plant authorizes a massive new production run. 

By the time the extra inventory arrives next month, the trend will have vanished, leaving the manufacturer with a warehouse full of expiring goods.

Traditional ERP and APS (Advanced Planning and Scheduling) systems actually worsen this. They are programmed with static safety stock formulas that react to historical variance. As we noted in our recent deep dive on Safety Stock Bloat, this leads to a quiet expansion of working capital that kills margins.

The Human vs. The Agent: Two Different Worlds

In 2026, the differentiator isn’t how much data you have; it’s how quickly you can reason through it.

1. The Human Planner: The “Hedge and Hope” Strategy

When a human planner sees a disruption, let’s say an ETA delay at a major port, their natural instinct is to over-correct. They lack the cognitive capacity to instantly calculate the downstream impact on 500 different SKUs across 12 distribution centers.

They manually increase the next three Purchase Orders (POs) by 15% “just in case.” So, the result is that this localized “safety” creates a massive inventory glut four months later when the port clears.

2. SpectraONE’s Agentic AI: The “Orchestrated Dampening” Strategy

An LLM-based agent doesn’t just look at a spreadsheet; it uses stochastic reasoning to understand the context of the signal. Our agents are built on a Multi-Agent System (MAS) architecture that functions like a digital brain. It breaks down the problem through multi-step reasoning.

2

The Sensing Agent: Detects a 10% lift in a specific region using multi-feature signals (weather, social sentiment, and local holidays).

The Reasoning Agent: Uses context-aware logic to ask: “Is this lift a trend or a fluke?” It cross-references the lift with recent promotion breakdowns to determine whether demand is cannibalized from a future week.

The Execution Agent: Instead of ordering 15% more for everyone, it autonomously negotiates a “micro-shift” in existing stock between two regional DCs and prepares the trigger for the ERP.

Technical Depth: Context-Aware Decision Support

A common misconception is that Large Language Models (LLMs) are being asked to solve the math of the supply chain. In the SpectraONE architecture, the LLM isn’t the calculator; it’s the Contextual Interpreter.

We have unified Retrieval-Augmented Generation (RAG), Digital Twins, and Optimization Engines into a single cohesive narrative:

  1. Context (LLM and RAG): The system “reads” the context of a disruption (e.g., a news report on a regional carrier strike).
  2. Simulation (Digital Twin): The agents ask the Digital Twin, “What is the projected impact if this specific node is delayed by 72 hours?”
  3. Calculation (Optimization Engine): The engine computes the numerical adjustments needed to maintain service levels.

SpectraONE agents can explain why they are dampening a signal. This “Explainable AI” is critical; according to 2026 industry benchmarks, 74% of AI implementations fail because planners don’t trust the “black box” (Source: SpectraONE – Why Most AI Tools Fail). 

SpectraONE provides a business-ready narrative: “I am recommending no increase to the PO because the current demand spike is highly correlated with a 3-day heatwave, not a structural shift in consumer preference.”

The Financial Impact: By the Numbers

The shift from reactive planning to agentic orchestration has measurable ROI. Recent 2025/2026 case studies in the FMCG and Retail sectors show that dampening the bullwhip via Agentic AI leads to:

Reduction in Excess Inventory by eliminating the “just in case” manual overrides that plague human planners.

Improvement in OTIF (On-Time In-Full) by sensing shortages 7–10 days earlier than traditional ERP systems (Source: Logistics Management 2026 Trends).

Reduction in Expedited Shipping Costs because the “panic” phase of the bullwhip is caught at the source, preventing the need for last-minute, high-cost logistics.

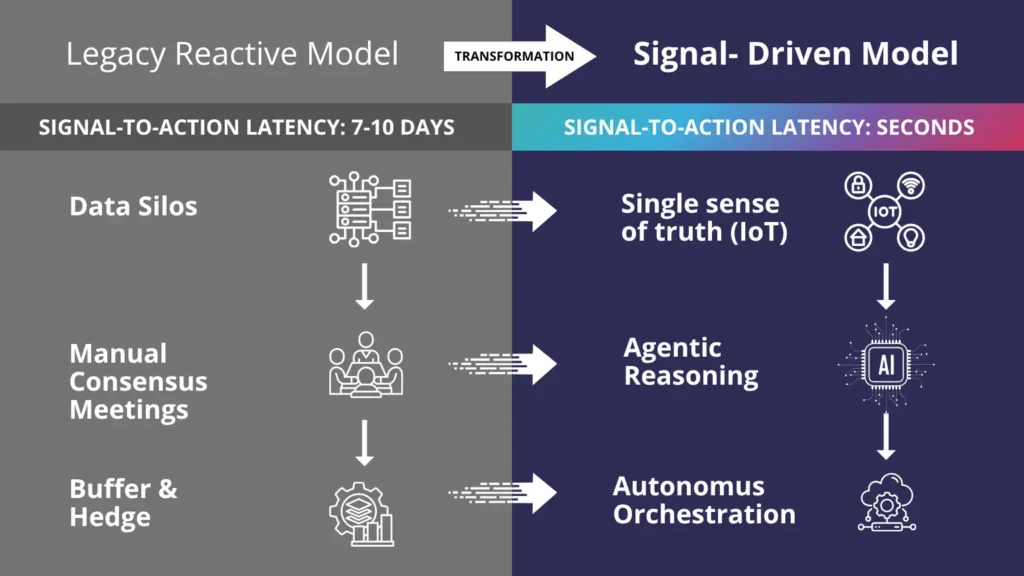
Moving to “Signal-to-Action” Parity

The-2026-Bullwhip-Why-Agentic-AI-is-the-Final-Shock-Absor-Blog-1

In 2026, the goal of a world-class supply chain is to achieve Signal-to-Action Parity. It means the moment a product is scanned at a retail checkout, the entire upstream supply chain from the DC to the raw material provider adjusts its expectations in unison.

SpectraONE’s SKU-Location forecasting ensures that this signal is accurate at the most granular level, while our agentic layer ensures that the reaction to that signal is measured, logical, and profitable.

Conclusion

The bullwhip effect is not an inevitability; it is a symptom of disconnected reasoning. While traditional tools gave us the data to see the wave coming, SpectraONE’s Agentic AI gives you the power to break the wave before it hits the factory floor. It is an Operational Intelligence and Execution system. 

We provide the brain that interprets the signal and the framework to execute the response. As we look toward the remainder of 2026, the market winners will be the companies that stop fighting the bullwhip and start dampening it through autonomous, intelligent orchestration.

AI Supply Chain APAC: Turning Regional Complexity into Predictable Performance

The Asia-Pacific region is one of the most complex supply chain environments in the world. Production may sit in one country, suppliers in another, and demand scattered across several fast-moving markets. Add currency shifts, port congestion, regulatory variation, and promotional volatility, and even well-run networks can feel fragile.

This is why conversations around AI supply chain APAC adoption are becoming more practical and less theoretical.

Leaders aren’t asking whether AI sounds innovative. They’re asking whether it helps them avoid the next disruption.

The Reality of APAC Supply Networks

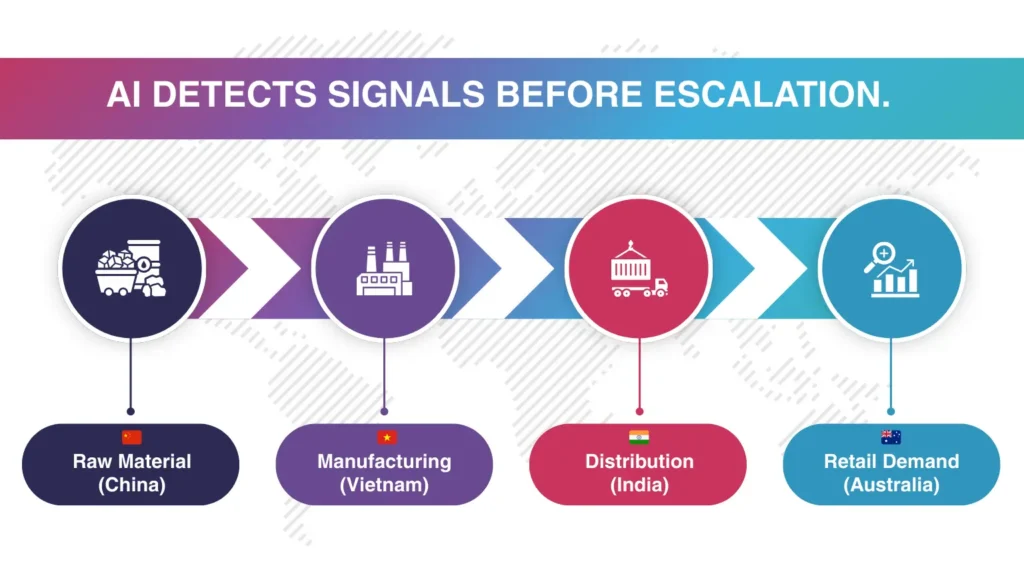
AI detects signals

APAC supply chains are deeply interconnected. A raw material delay in China can quietly affect manufacturing in Vietnam. A demand spike in India can distort regional inventory planning. Often, the signals appear small at first — a slight increase in order frequency, a minor lead-time stretch, a subtle shift in channel mix.

Traditional systems capture the data. They just don’t always connect it early enough.

Most enterprises already have ERP systems, reporting dashboards, and planning tools. The issue isn’t visibility. It’s an interpretation. By the time risks are obvious in reports, they’ve usually already impacted service levels or working capital.

AI supply chain APAC strategies focus on identifying these early patterns — before they become operational emergencies.

Why Forecasting Alone Isn’t Enough

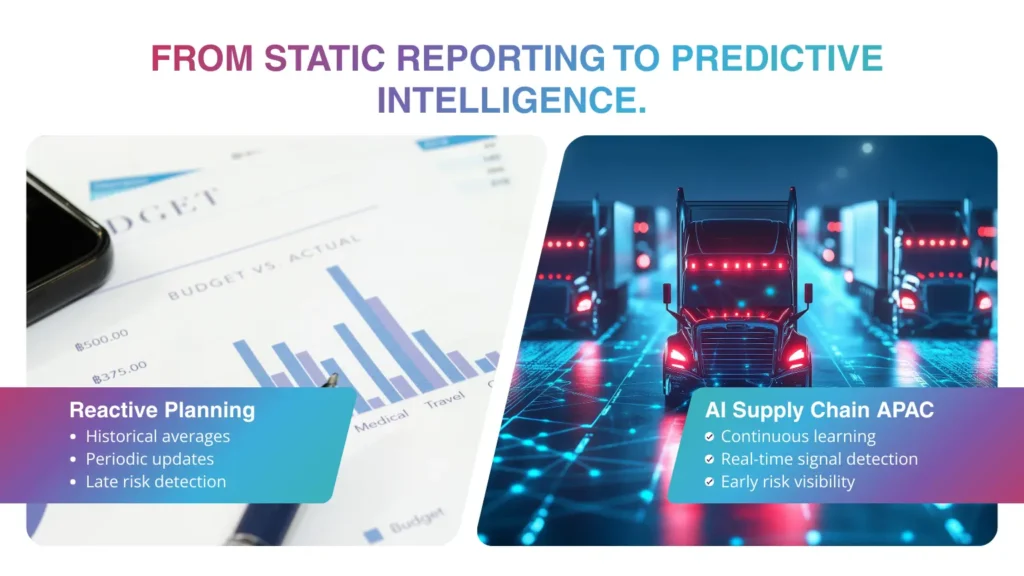
Static vs Predictive Intelligence

Forecasting is often where improvement begins. In many APAC markets, demand patterns don’t behave consistently year over year. Growth can be sharp but uneven. Promotions distort baseline trends. Urban consumption shifts quickly. Relying purely on historical averages creates instability.

AI-driven forecasting models learn continuously. They adjust as patterns shift instead of waiting for the next planning cycle. Over time, this reduces the gap between planned and actual demand. But forecasting is only one part of the equation.

AI supply chain APAC platforms extend beyond demand numbers. They correlate supply variability, production constraints, and logistics performance. When signals move in different parts of the network, AI can surface connections that manual reviews might miss.

This changes how teams respond. Instead of reacting to shortages, they anticipate them. Instead of expediting shipments, they rebalance earlier.

Cross-Border Complexity Requires Connected Intelligence

One defining characteristic of APAC operations is geographic spread. Few enterprises operate within a single national boundary. Most manage multi-country networks, each with its own regulatory requirements and infrastructure reliability.

Without connected intelligence, planning becomes siloed. Regional teams optimize locally, sometimes at the expense of the broader network.

AI supply chain APAC solutions create a unified analytical layer. They help organizations see how decisions in one country influence performance in another. This improves coordination and reduces unintended ripple effects.

For enterprises managing multiple markets simultaneously, this broader perspective is critical.

Trust and Explainability Matter

Adopting AI in enterprise environments is not just about model accuracy. It is about trust.

Planners and operations leaders need to understand why a system is recommending a change. If the logic is opaque, resistance follows.

Explainable AI addresses this directly. When a forecast shifts, the system should indicate what’s driving it, whether it’s order frequency, supply delays, or channel variation. Confidence indicators help teams judge how aggressively to respond.

In APAC organizations, where decisions often involve multiple stakeholders, clarity speeds alignment.

AI supply chain APAC transformation works best when it supports human judgment rather than attempting to replace it.

Where SpectraONE Comes In

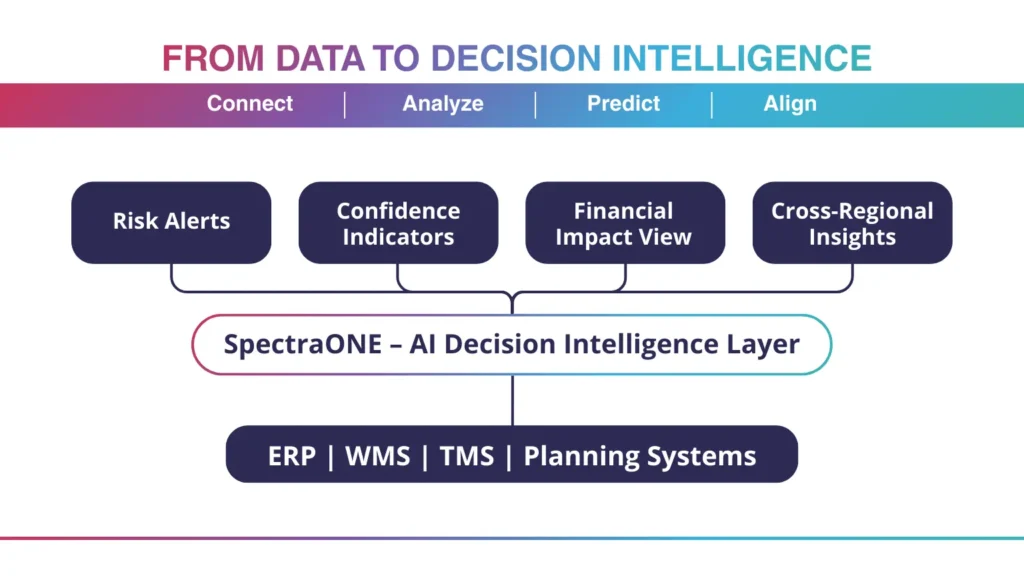
AI Decision Intelligence Layer

SpectraONE supports enterprises pursuing AI supply chain APAC initiatives by acting as a decision intelligence layer across existing systems.

Instead of replacing ERP or planning tools, SpectraONE connects demand, supply, inventory, production, and logistics signals into one continuous analytical view. It monitors patterns, flags emerging risks, and provides contextual insight into potential operational and financial impact.

For companies operating across multiple APAC markets, this reduces blind spots and shortens response time.

The objective isn’t to generate more data, but to bring clarity to it.

The Competitive Shift

APAC will likely remain one of the most dynamic supply chain environments globally. Growth will continue, but so will volatility.

Enterprises that depend solely on historical reporting will find themselves reacting more often than planning. Those investing in AI supply chain APAC capabilities gain a structural advantage: earlier detection, stronger coordination, and more confident execution.

In a region where small disruptions can cascade quickly, foresight becomes more valuable than hindsight.

Frequently Asked Questions

What does AI supply chain APAC mean?

It refers to the use of artificial intelligence to improve forecasting, risk detection, and operational decision-making across supply chains operating in the Asia-Pacific region.

How does AI improve supply chain resilience in APAC?

AI analyzes real-time demand and supply signals to detect emerging risks early, enabling proactive adjustments before disruptions escalate.

The objective isn’t to generate more data, but to bring clarity to it.

Yes. While large enterprises benefit significantly, mid-sized companies operating across multiple countries can also improve forecasting and inventory efficiency through AI-driven planning.

Why ETA Variability Is the Real Cost Driver in Logistics

The Hidden Cost of Delivery Variability in North American Supply Chains

If your routes are optimized but your costs keep spiking, distance is no longer your real problem.

North American shippers have squeezed most of the waste out of mileage and routing. Yet OTIF penalties, expediting, and buffer inventory continue to rise. The gap is not in how shipments are routed, it’s in how reliably they arrive. ETA variability has quietly become the dominant risk variable in modern logistics, and most planning systems still treat it as an afterthought.

Across North America, freight markets have undergone structural volatility over the past five years. Spot rate swings, port congestion, labor shortages, and capacity shifts have reshaped logistics planning.

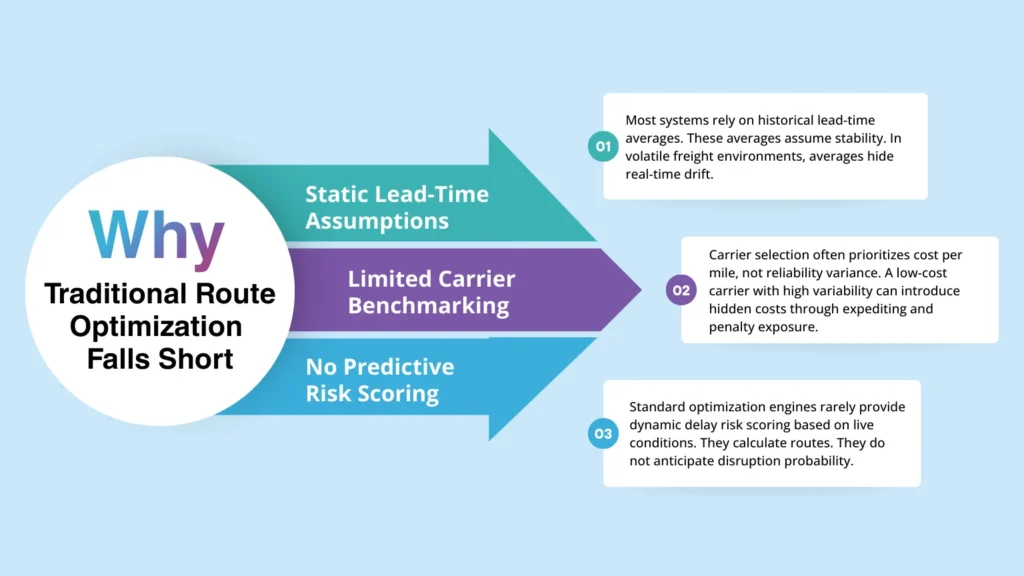
According to the American Trucking Associations, trucking alone moves over 72% of U.S. freight by weight. Meanwhile, supply chain disruptions between 2020 and 2024 exposed the fragility of delivery predictability. Most organizations responded by investing in route optimization tools, and it works to a point; it reduces distance, fuel cost, and basic routing inefficiencies. 

But here’s the operational truth: route optimization solves geometry, and it does not solve variability.

Why Distance Is No Longer the Primary Risk Variable

Traditional logistics systems optimize for the shortest path, the lowest cost route, and pre-defined constraints. However, modern logistics volatility is rarely driven solely by distance. It is driven by variability in carrier performance, port congestion, border delays, weather anomalies, capacity bottlenecks, and regulatory inspections.

When variability increases, even the most optimized route fails to deliver predictably. This leads to late OTIF penalties, expedited freight, customer dissatisfaction, reactive re-planning, and higher upstream buffer inventory.

According to studies, companies with limited supply chain visibility experienced 2–3x more disruption-related cost exposure during recent volatility cycles. The issue is not route length; it is signal timing.

The Operational Impact of ETA Variance

Traditional systems update ETAs after the delay becomes visible. By then, response options are limited.

Route Optimization Isn’t Enough Why Variability Not- Blog

ETA accuracy directly influences production scheduling, warehouse staffing, retail shelf replenishment, cold-chain integrity in F&B, and compliance exposure in pharma. Even small ETA deviations compound downstream. 

For example:

Refrigerated freight (F&B) 

A small 6-hour delay in a refrigerated trailer’s arrival at a cross-dock can push product beyond its optimal temperature exposure window. Industry analyses estimate that 8–15% of global food loss is linked to cold-chain failures, much of it tied to timing and handling deviations rather than total transit distance.

Inbound to manufacturing 

A one-day delay on a critical raw material or component can force production planners to reshuffle lines, switch to less efficient production runs, or idle labor and equipment. In surveys of manufacturers, over 40% report that unplanned delivery delays are a top-3 driver of overtime and expediting costs, even when their routing is already optimized.

Retail distribution centers and shelf availability 

A delayed inbound truck into a retail DC can trigger shelf-level stockouts even when there is technically enough inventory in the broader network. Studies on on-shelf availability consistently show that 30–40% of stockouts are caused by upstream replenishment or inbound timing issues, not by true inventory shortages.

How SpectraONE Addresses Logistics Variability at the Signal Level

SpectraONE enhances existing TMS and ERP systems by adding a real-time intelligence layer that focuses on predictive risk and variance control. It does not replace routing engines; it strengthens decision timing.

Predictive ETA Intelligence

SpectraONE applies transformer-based pattern recognition across telemetry, carrier performance history, and contextual logistics signals.

Instead of static ETAs, teams gain dynamic variance forecasting, risk-probability scoring, and early-drift alerts. This enables proactive mitigation before delivery commitments are missed.

Carrier Performance Benchmarking Beyond Cost

SpectraONE analyzes carrier variability patterns, not just rate structures. Teams can evaluate historical delay frequency, lane-level volatility, and seasonal performance deviations. This allows selection decisions based on reliability, not only price.

Real-Time Risk and Exception Monitoring

Rather than waiting for shipment status changes, SpectraONE surfaces early warning signals tied to route congestion indicators, external market shifts and regional disruption patterns. This early signal awareness reduces the need for reactive expediting.

What Changes After Implementation

How SpectraONE Reduces Safety Stock Without Increasing Stockout Risk

Logistics and 3PL operators typically observe:

  • Improved ETA reliability
  • Reduced last-minute expediting
  • Lower penalty exposure
  • Better alignment between inbound and production schedules

More importantly, planning teams begin making routing decisions based on predicted risk rather than post-event reporting.

The Strategic Shift 

From Route Optimization to Variance Control

Traditional model
Optimize distance → React to delay.
Signal-driven model
Predict variability → Adjust before delay.

This shift impacts transportation cost stability, service-level reliability, cold-chain integrity, and network resilience. In volatile freight environments, variance control is more financially significant than marginal distance savings.

Test ETA Variance Control in 14 Days

No replacement of your TMS | No disruption to current workflows | No integration overhaul

If your logistics team is optimizing routes but still absorbing unpredictable delivery shifts, the missing element may not be routing efficiency. It may be predictive signal intelligence.

The SpectraONE 14-Day KPI Challenge enables you to select one KPI (ETA Accuracy, Expedite Rate, OTIF), analyze real shipment data in a controlled environment, and measure variance visibility improvements.


Select one KPI and run the 14-day evaluation.
Measure whether predictive visibility reduces variability cost.

Safety Stock Bloat in Retail and FMCG: Why Working Capital Is Quietly Expanding

The Structural Shift in Demand Volatility Across North America

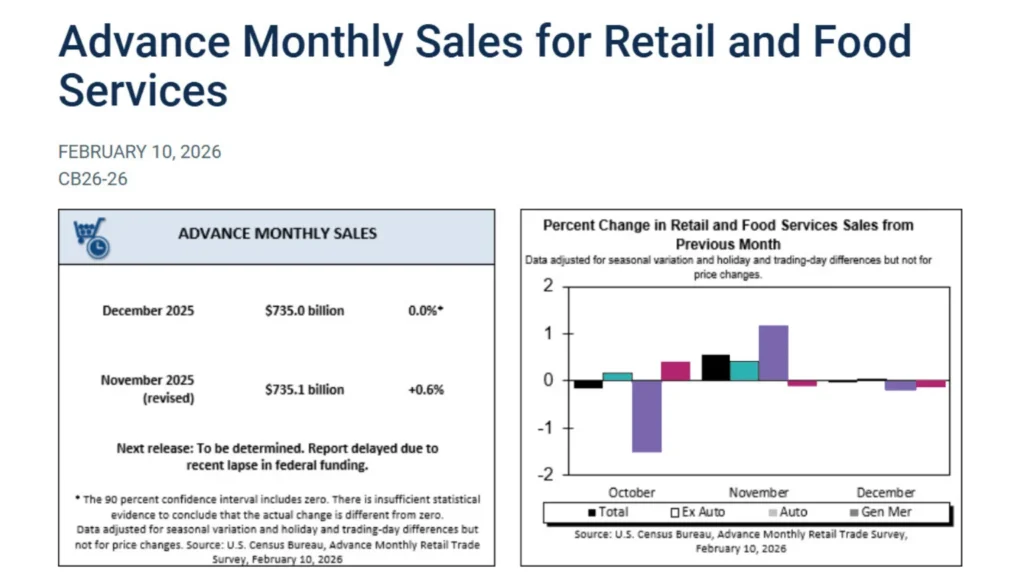
Over the past five years, supply chains across North America have entered a structurally volatile environment. Retail sales alone exceed $700 billion per month in the United States (U.S. Census Bureau). At that scale, even small variations in demand patterns have a measurable financial impact.

Simultaneously, food and beverage manufacturers operate in a market comprising more than 42,000 facilities across the U.S. (USDA ERS). These networks are managing shorter product lifecycles, faster promotional cycles, and higher customer expectations.

According to McKinsey, 82% of supply chains report experiencing disruptions linked to trade or geopolitical volatility. These disruptions amplify lead-time uncertainty and demand variability.

In response, most organizations have adopted a defensive posture and increased safety stock. While this reaction feels prudent, it often masks a deeper structural issue.

Why Safety Stock Levels Continue to Rise

A safety stock is designed to protect service levels as variability increases. However, in today’s environment, three structural factors are quietly inflating buffer levels.

1. Delayed Detection of Demand Drift

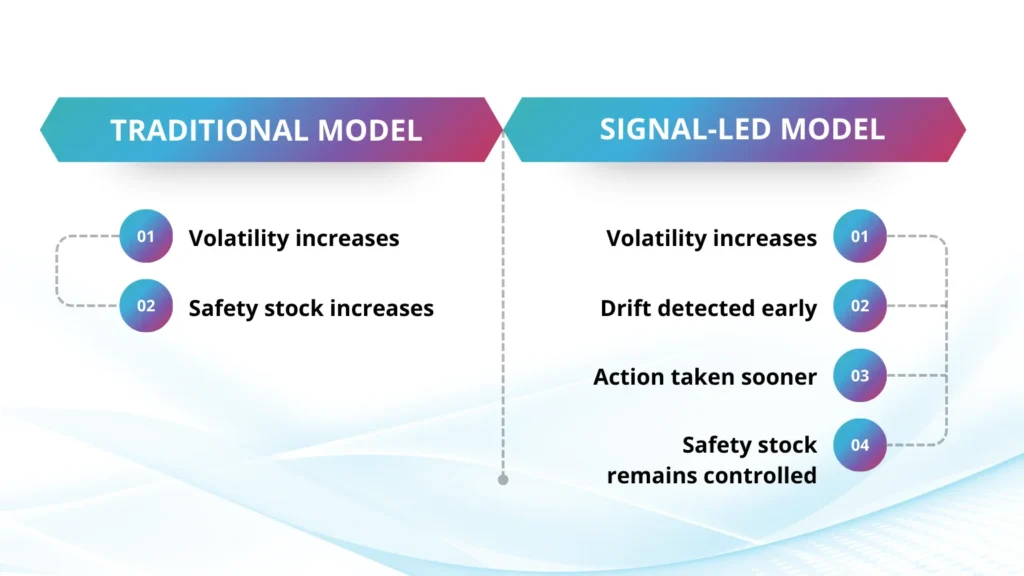
Traditional planning systems rely on historical variance and periodic recalculation cycles. Demand deviations are recognized only after sufficient historical data accumulates to make the shift statistically visible. 

By the time a deviation is formally recognized, replenishment cycles have already been executed, production completed, and transfers scheduled. The common response in the next cycle is to increase buffer levels to avoid recurrence. This reactive adjustment compounds over time.

2. Node-Level Imbalance in Retail Networks

Retail inventory often appears balanced at an aggregate level. However, imbalance frequently develops at indivRetail inventory often appears balanced at an aggregate level. However, imbalance frequently develops at individual stores, distribution centers, or regional clusters. When demand shifts unevenly across nodes, some locations accumulate excess inventory, others experience stock pressure, and redistribution occurs too late to prevent margin erosion.

Without real-time visibility into node-level drift, organizations compensate by raising overall safety stock, even though the root problem is distribution misalignment rather than total demand insufficiency.

3. Manual Override Amplification

InIn volatile environments, planners often override system-generated forecasts to reduce perceived risk. While overrides are sometimes necessary, they introduce bias into subsequent planning cycles. Over time, overrides become embedded assumptions, forecast variability appears artificially elevated, and safety stock calculations lead to further buffer inflation.

This cycle is rarely reversed once it becomes embedded in the planning process.

The Financial Implications of Safety Stock Bloat

Excess safety stock impacts far more than warehouse space. It directly influences, working capital allocation, inventory carrying costs, markdown exposure, obsolescence risk and sash flow flexibility.

The Institute of Business Forecasting notes that improving forecast accuracy by 10–20% can significantly reduce inventory levels and associated carrying costs. However, improving forecast accuracy alone does not resolve the timing issue that drives buffer inflation. The critical factor is not only accuracy, but also signal timing.

How SpectraONE Reduces Safety Stock Without Increasing Stockout Risk

How SpectraONE Reduces Safety Stock Without Increasing Stockout Risk

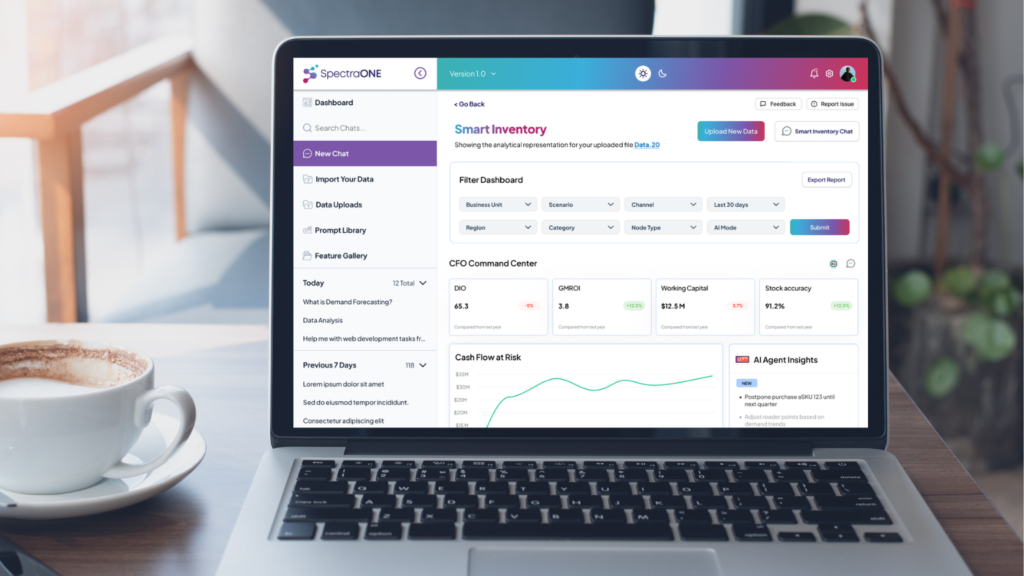
SpectraONE does not replace ERP, forecasting, or replenishment systems. Instead, it introduces a real-time signal intelligence layer that enhances the timing and quality of operational insight. The measurable difference lies in how volatility is detected and interpreted.

Early Drift Detection Before Variance Becomes Structural

SpectraONE applies transformer-based pattern recognition and contextual reasoning to structured operational data. Rather than waiting for deviations to accumulate across planning cycles, it identifies unusual drift as it begins to form. 

This earlier detection allows teams to adjust replenishment before the imbalance widens, reallocate inventory before shortages intensify, and modify procurement plans before excess builds. By acting sooner, organizations reduce the need to increase safety stock defensively.

Node-Level Visibility Across Retail and FMCG Networks

In retail and FMCG environments, performance distortion rarely appears uniformly. SpectraONE surfaces node-level variations in demand and supply, enabling planners to understand where imbalances are developing. 

Instead of raising network-wide buffers, teams can target specific nodes for redistribution, protect high-risk clusters without inflating global stock, and maintain service levels with lower overall inventory exposure. This precision reduces working capital strain while maintaining customer satisfaction.

Scenario Simulation Before Buffer Expansion

SSafety stock increases are often implemented without structured scenario evaluation. SpectraONE enables operational teams to simulate sustained demand drift, lead-time normalization, promotion extension effects, and supply-side variability. 

Rather than adjusting buffers based on uncertainty, planners can test potential outcomes before committing capital.

Reducing Manual Override Dependency Through Explainable Insight

SpectraONE provides contextual explanations behind detected anomalies. By identifying likely drivers such as regional lift patterns or correlated supply shifts, planners gain greater confidence in system-generated insight. Improved trust reduces unnecessary overrides, which in turn stabilizes future safety stock calculations.

What Changes Operationally After Implementation

Organizations implementing SpectraONE typically observe:

  • Reduced reactive buffer adjustments
  • Clearer node-level visibility
  • Improved alignment between forecasting and replenishment
  • Greater confidence in lowering safety stock in stable clusters

The transformation is not abstract; it is operational. Safety stock becomes a deliberate decision variable rather than a reflexive protection mechanism.

Moving From Buffer Management to Signal Management

The fundamental shift in modern supply chain planning is not eliminating safety stock. It is managing it intelligently.

This distinction directly impacts margin, working capital, and inventory turns.

Test the Impact Before You Commit

If safety stock has steadily increased in your organization over the past several years, the most important question is not whether volatility exists. It is whether your systems detect that volatility early enough to avoid defensive over-buffering.

The SpectraONE 14-Day KPI Challenge enables you to select one KPI (Inventory Turns, Forecast Accuracy, Stockout Rate), run a structured 14-day signal analysis, and measure whether earlier visibility reduces buffer dependence.


No system replacement | No integration risk | No workflow disruption.

Choose one KPI and test it for 14 days.
Measure the operational difference before scaling.

Explainable AI in Demand Forecasting: Building Trust When Stakes Are High

Demand forecasting has always been a tightrope walk. Planners are working with imperfect data, changing customer behavior, promotions that distort demand, supply constraints, and constant pressure to protect service levels without tying up too much cash in inventory. Over time, Advanced analytics and AI have helped teams forecast more accurately, respond faster, and make decisions at scale.

But as forecasting models get more sophisticated, a new problem shows up: the forecast might be “right,” yet still hard to trust operationally.When the numbers suddenly shift or the system recommends a meaningful change in production or inventory – teams naturally ask why before they act. And when service, revenue, compliance, and customer commitments are on the line, trust matters just as much as accuracy.

Why Accuracy Alone Isn’t Enough Anymore

1-2

Traditional forecasting often leaned on straightforward logic: historical averages, simple seasonality, rules of thumb, and planner experience. Those methods weren’t perfect, but they were easy to explain. You could usually point to a reason: a seasonal lift, a recent sales trend, a known customer event.

Modern AI can look at hundreds of signals at once. It finds patterns humans might miss, connects data across channels, and adapts continuously as conditions change. This is powerful, but it can also feel opaque to business users.

So when the model raises demand by 12% for a specific SKU, planners start asking practical questions:

  • Is this increase because sales are accelerating or because of a promo?
  • Is this a stable pattern, or will it swing back next week?
  • How confident should we be before we commit inventory, capacity, or spend?

If the system can’t answer those questions clearly, people hesitate. They override the forecast manually, delay decisions, or rebuild the plan in spreadsheets “just to be safe.” Over time, this erodes confidence in the system, even if the model itself is statistically sound. The core issue often isn’t performance. It’s interpretability and trust.

Why Accuracy Alone Isn’t Enough Anymore

1-3

Explainable AI doesn’t mean showing planners algorithms or math formulas. In a business setting, explainability means the forecast is understandable, actionable, and defensible.

In demand planning, that usually looks like:

  • Visibility into the key drivers behind a forecast change
  • Clear flags when a forecast deviates from normal patterns
  • Confidence signals that indicate how aggressively to act
  • Traceability from the forecast back to the underlying data signals

Instead of getting a number with no context, planners see what’s influencing it—demand acceleration, channel shifts, changing seasonality, customer behavior, or external disruptions. That makes it easier to apply professional judgment in the right way, without blindly trusting the system or rejecting it outright.

Explainability also improves collaboration across functions. Finance teams want to understand revenue implications. Operations teams need confidence before committing capacity. Leadership needs clarity when making strategic decisions. A transparent forecasting system aligns these conversations around a shared view of what is happening and why. 

How Explainability Changes Day-to-Day Planning

When forecasting is explainable, the daily conversation changes.

Teams spend less time debating whose number is “correct” and more time discussing what the signals mean and what to do next. Instead of “Do we trust this forecast?” the question becomes: “What’s changing—and how should we respond?”

Planners can validate shifts faster, prioritize exceptions more effectively, and act earlier rather than firefighting later. Over time, that builds confidence not just in the model, but in the entire planning process.

A Simple Real-World Example

Imagine demand for a critical SKU starts creeping up in a specific region. It’s gradual enough that traditional weekly reporting doesn’t make it look urgent. Everything still appears “within range.”

An AI model, however, detects a consistent shift across order frequency, channel mix, and customer behavior. It increases the forecast and assigns a moderate confidence level.

With explainability built in, the planner can see the rise is being driven mostly by repeat orders from a specific customer segment, and not a one-time spike. The confidence signal shows the pattern has held across multiple cycles.

That context makes the decision easier: adjust replenishment early, coordinate with sales, and prevent shortages without overreacting. The action feels informed, not speculative.

Why Trust Matters Even More When the Stakes Are High

In industries like pharma, FMCG, manufacturing, and regulated supply chains, the downside of getting it wrong is significant.

  • Overproduction ties up working capital.
  • Underproduction risks service failures and lost revenue.
  • Compliance requirements demand auditability and consistency.

In these environments, explainability isn’t a “nice to have.” It’s often the difference between AI being adopted at scale, or being used cautiously by a small group while everyone else works around it.

When AI systems are transparent and traceable, leaders can defend decisions internally and externally. And the organization can expand usage confidently across cycles, regions, and product lines.

How SpectraONE Approaches Explainable Forecasting

1-4


SpectraONE is built to make explainability part of the workflow, not an add-on.

It connects demand, supply, inventory, production, and logistics into a unified intelligence layer. Forecast outputs come with driver context, confidence indicators, and early signal detection – so teams can see what’s changing, what’s driving it, and how reliable it appears.

The goal isn’t just “better numbers.” It’s better decisions: faster alignment, clearer financial visibility, and more confident execution under uncertainty.

Looking Ahead

As AI reshapes supply chain planning, the big question will increasingly shift from:

  • “Can the model predict accurately?”
    to
  • “Can we trust it—and operationalize it at scale?”

Explainable AI is what bridges that gap. It helps planners and leaders understand the “why” behind the forecast, apply judgment with confidence, and build resilience into daily decisions.

The real value of AI in forecasting isn’t only better predictions, it’s clearer reasoning, better alignment, and more confidence when it matters most.

Why Multi-Feature Forecasting Matters in 2026

A forecast can be accurate on paper but still not useful in your daily work. If you’re in supply chain or demand planning, you’ve probably felt this frustration. You get a number, but not the reasons behind it. There’s no clear idea of what changed, why it happened, or if you can trust it.

Remember the last time demand spiked or dropped suddenly. Was it because of a promotion, a seasonal trend, an unexpected storm, or a social media campaign you know about later? Or did your tool just give you a number and nothing more?

Many traditional forecasting tools are outdated, acting as if it’s still 2016. They see demand as a simple trend and expect tomorrow to be just like yesterday. But 2026 brings new challenges, and demand now relies on more than just past numbers.

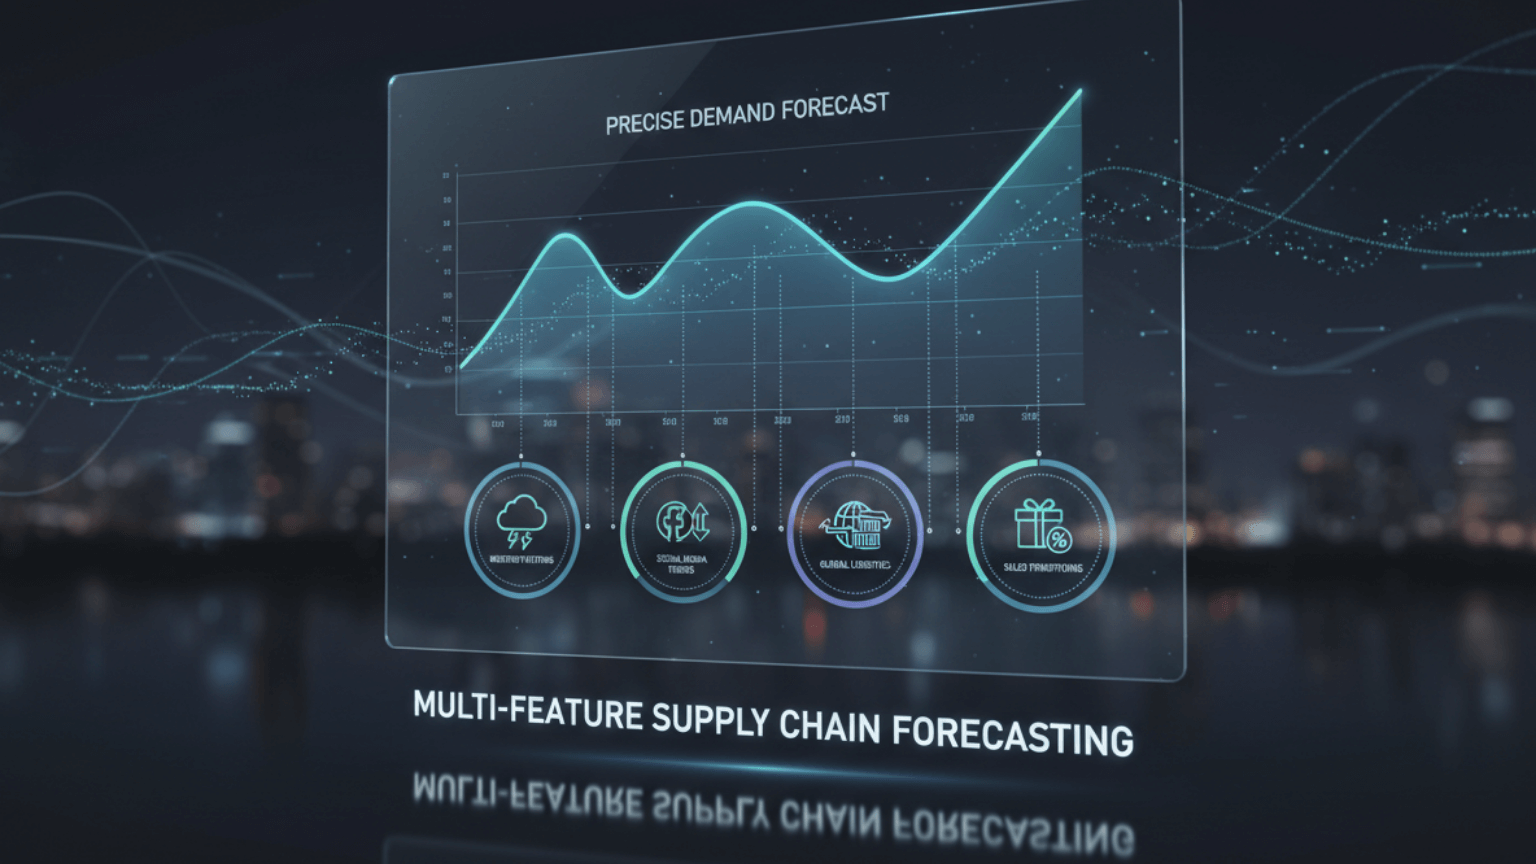
SpectraONE uses multi-feature forecasting, a smarter, more context-aware method that incorporates many real-world signals. This makes forecasts more accurate, easier to understand, and more trusted by the teams who rely on them.

What Is Multi-Feature Forecasting?

Multi-feature forecasting does much more than just look at sales history. Instead of only asking, “What happened last year?” it asks, “What’s really driving demand right now?” 

It provides the forecasting engine with many relevant signals, such as product details, pricing, promotions, external factors, and supply chain events, to identify what really matters. It’s like moving from a single, blurry camera to a clear, multi-angle view of your business.

How This Plays Out in the Real World:

Retail – Are You Still Guessing Seasonal Demand?

When you plan demand for a seasonal drink, do you mainly use last year’s numbers and a few spreadsheets? Traditional tools stop there, but SpectraONE does more. It brings together weather forecasts, promotion calendars, and local holiday data with your sales history. It helps you predict more accurately when and where demand will rise, so you can stock the right products in the right stores at the right time, instead of reacting after shelves are empty.

Manufacturing – Still Fighting Last-Minute Shortages?

When you plan for component demand, do you only check past usage and hope suppliers deliver on time? Many tools stop there. SpectraONE goes further by checking lead-time changes, BOM constraints, and supplier OTIF (on-time in-full) performance. Your team can spot problems earlier, cut down on rush orders, avoid last-minute fixes, and keep production running smoothly.

Food & Beverage – Are You Finding Out About Waste Too Late?

If you only track expiry dates, you’re reacting to waste instead of preventing it. Many tools stop at “use by” dates. SpectraONE predicts spoilage risk earlier by using cold-chain data, dwell times, and promotion surges. Your team can act before products go bad by adjusting orders, reallocating stock, and protecting margins while still providing excellent service.

What Data Signals Does SpectraONE Actually Use?

SpectraONE’s models pull from multiple layers of signals across your business and beyond, including:

Product & InventorySKU attributes, safety stock, locations
Time-Based SignalsSeasonality, holidays, launch cycles, and day-of-week patterns
Promotions & PricingPrice changes, elasticity, historical uplift, and promo fatigue
External DataWeather, inflation, macroeconomic indicators, and public events
Supply Chain SignalsLead-time reliability, in-transit delays, carrier performance, and bottleneck locations
Customer BehaviorChannel sales, churn, reorder rates, and mix shifts across regions and channels
Operational ConstraintsCapacity limits, MOQs, sourcing risk, and internal business rules your planners must live with every day.

It’s not just about how well the model works. SpectraONE is built so planners and operations teams can quickly see why the forecast looks the way it does and, more importantly, what to do next.

Instead of just looking at a number and asking, “Can we trust this?”, your team can ask better questions like, “What’s driving this?” and “What should we do next?”

Why This Matters to Your Team in 2026

Why Multi-Feature Forecasting Matters- Blog


Most old systems still act like it’s 2016. They give you one number with little or no explanation. What happens then? Planners second-guess the system, copy data into Excel, create their own versions of the truth, or send analysts lots of “what if” questions.

With SpectraONE, you get more than just a prediction. You also get the story behind it. The model shows what’s driving the trend, like a delayed shipment, an upcoming promotion, unusual weather, a supplier issue, or a change in customer behavior. Your team doesn’t have to guess; they can act.

That is the difference between just having a number and gaining a real, valuable insight your team can act on right away.

The Tech Behind SpectraONE: LLMs and Transformer Models (Without the Black Box)

4

Behind the scenes, SpectraONE’s forecasting engine uses transformer-based models and LLMs. For your team, this means:

  • It can detect patterns across many variables simultaneously, not just time and quantity, so you see links that traditional tools miss
  • It explains results in clear, understandable language, so planners don’t need a data science degree to interpret the forecast.
  • It adapts quickly when market conditions shift, so your planning process isn’t stuck with last quarter’s assumptions in a fast-moving 2026 market.

Unlike static statistical models or unclear “black box” AI, SpectraONE’s forecasts can be audited, explained, and traced back to real inputs. It helps you build trust with finance, leadership, and frontline teams.

What Your Team Really Needs Next

3

Multi-feature forecasting is more than just a buzzword. It changes how planning teams work, moving from relying on unclear, history-only tools to working with AI that understands context and explains its reasoning.

If your current process still depends on sales history, tribal knowledge, and spreadsheet workarounds, SpectraONE can help you shift to a more flexible, insight-driven planning approach that understands both your context and your data.

Planning like it’s 2016 won’t be enough for 2026. Teams that act now will gain better visibility, stronger operations, and more confidence across the business. The longer you wait, the bigger the gap gets.

If you want to see the difference in 30 days. You don’t have to change your whole planning process to find out if this works for you. That’s why we offer a focused 30-day pilot program.

In just one month, your planners can:

  • Run SpectraONE forecasts in parallel with your current process.
  • See how multi-feature forecasting performs on your real data.
  • Understand which signals actually move the needle in your business.
  • Experience what it’s like to get both a forecast and a clear explanation behind it.

Many teams are already using pilots like this to show the value internally and then scale up quickly. If you wait, you’re giving your competitors more time to learn, improve, and get ahead.

spectra Blog Banner (843 x 300 px)

Why the Next 12 Months Will Redefine Supply Chain Competitiveness

A Data-Backed Look at Why Becoming AI-Ready Can’t Wait

If you work in supply chain or operations, you already know the truth:
The last few years rewrote the playbook. Businesses faced more disruption in three years than in the previous thirty, and the ripple effects are still here.

But underneath all that volatility, something much bigger is happening:

AI-ready supply chains are starting to pull ahead of everyone else, quickly and in measurable ways.

The performance gap is already visible in real numbers across accuracy, inventory, logistics stability, cost efficiency, and decision speed.

Below is the clearest picture of that shift, grounded entirely in published research, and why the next 12 months will determine who moves ahead and who falls behind.

1. Forecast Accuracy: Where Most Companies Win or Lose Margin:

3

If there’s one metric that shapes almost every other cost in the supply chain, it’s forecast accuracy.

Research shows:

  • Every 1% improvement in forecast accuracy reduces inventory by ~0.6–1% (Gartner).
  • Companies in the top quartile of forecast accuracy enjoy up to 15% higher profit margins than competitors (McKinsey).
  • 61% of companies say demand volatility is their #1 risk (Accenture).

And the consequences of poor forecasting are massive:

  • Inventory levels increased 30–40% across industries since 2020 (BCG).
  • $1.1 trillion in global working capital is tied up in excess inventory (The Hackett Group).

Retailers lose $1 trillion every year to stockouts — with 30–40% caused by preventable planning issues (NielsenIQ).

2. Inventory & Working Capital: The Price of Staying “Traditional”

1

Across FMCG, pharma, automotive, CPG, retail and distribution, AI-enabled supply chains consistently outperform on working capital.

Industry transformation benchmarks show:These ranges line up with published benchmarks from McKinsey, Bain, Gartner, and BCG.

Impact AreaTypical ROI
Inventory Reduction 8–15%
Lost-sales reduction5–10%
Forecast accuracy improvement20–40%
Planner time saved 40–60%
Logistics/overtime cost reduction10–20%
Vendor fill rate improvement3–7%
Revenue uplift2–5%

3. Logistics & Execution: Where Hidden Margin Leakage Lives

5


Even the best plan collapses if execution is unstable.

The data is clear:

  • Average ETA deviation: 20–40% across mid-to-large fleets (FourKites, project44).
  • Up to 50% of expedited shipments are preventable with better visibility (McKinsey).
  • Real-time visibility leaders achieve:
    • 10–20% lower logistics costs
    • 30–50% faster reaction time
    • 5–15% OTIF improvement

60–70% of disruptions escalate because exception handling is still manual (Gartner).

4. Decision Automation: The New Productivity Divide

The biggest differentiator emerging today isn’t software — it’s how companies make decisions.

Here’s the reality:

  • Planners still spend 30–40% of their time gathering and cleaning data (Gartner).
  • 70% of organizations still rely on spreadsheets for critical decisions (EY).
  • Only 7% of supply chain leaders say they have end-to-end real-time visibility (McKinsey).

Companies pulling ahead are the ones that:

  • Clean and unify operational data
  • Automate repetitive decisions
  • Use AI to flag risks earlier
  • Create a closed loop between planning → execution → financial outcomes Within 12–24 months, these changes create permanent cost and agility advantages.

5. Why Timing Matters: The 12-Month Window

Every major consulting firm now agrees on one core trend:

Early adopters of AI-ready supply chains gain exponentially more benefit than late adopters.

Why?

  • Data advantages compound over time
  • Operational stability frees up teams from firefighting
  • Financial visibility improves capital allocation
  • AI models learn and widen the gap each quarter

In simple terms:

The next 12–18 months will create the cost leaders of the next decade.
Those who delay will be at risk.

The Shift Has Already Begun

The evidence is clear: supply chains that invest in data quality, automation, and AI are separating from those that continue to rely on manual, reactive processes. This divide isn’t forming years from now, it is forming quarter by quarter, in accuracy, cost, agility, and resilience.

The organizations moving today are not chasing trends. They are building the foundations that every competitive supply chain will need: clean data, connected systems, faster decisions, and real-time visibility. Those who wait will face a growing gap in performance, cost competitiveness, and customer service that becomes harder to close with every cycle.

The next 12 months represent a rare window — a chance to step ahead while the industry is still transitioning.

Where SpectraONE Fits 

4

If your organization is exploring this shift, SpectraONE helps teams build AI-ready forecasting and execution through:

  • Unifying and preparing operational data
  • Improving forecast quality with AI-assisted planning
  • Enabling predictive visibility across logistics
  • Measuring financial impact at every stage

Teams can start with a low-risk pilot that benchmarks your current performance and quantifies the financial impact across planning, logistics, and working capital.

The goal isn’t technology adoption; it’s building the capabilities required for how tomorrow’s supply chains will function.

Written by Sravya Priya – Digital & Content Specialist working on AI-led supply chain ideas and turning complex data into practical insights for operations teams.