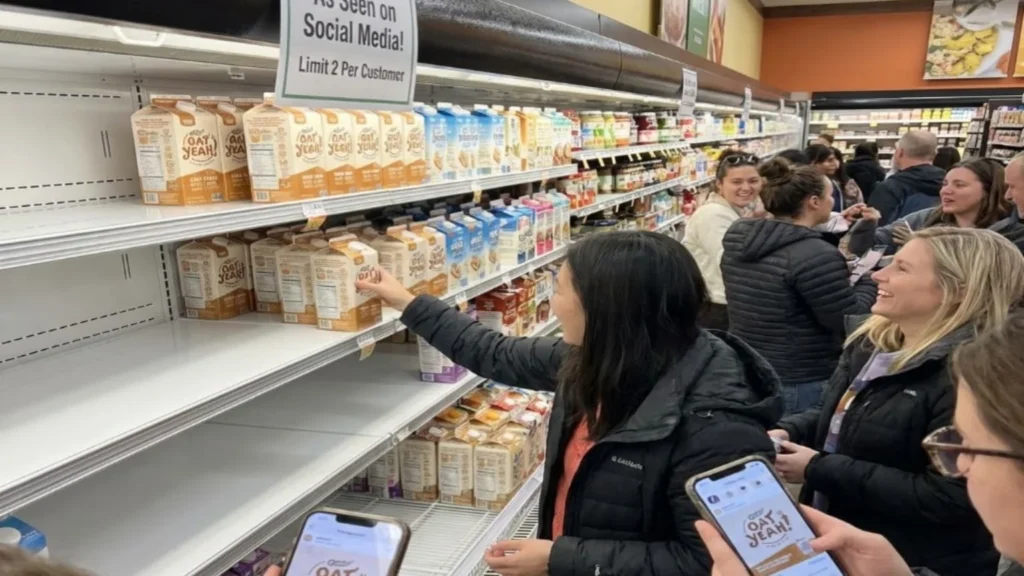
Most manufacturing and retail supply chains run on a fragile assumption. We assume that if our direct vendors are stable, our operations are secure. But the real vulnerabilities are rarely found at the surface. The real disruptions come from deeper down, the raw material processors and component suppliers you don’t even have contracts with.
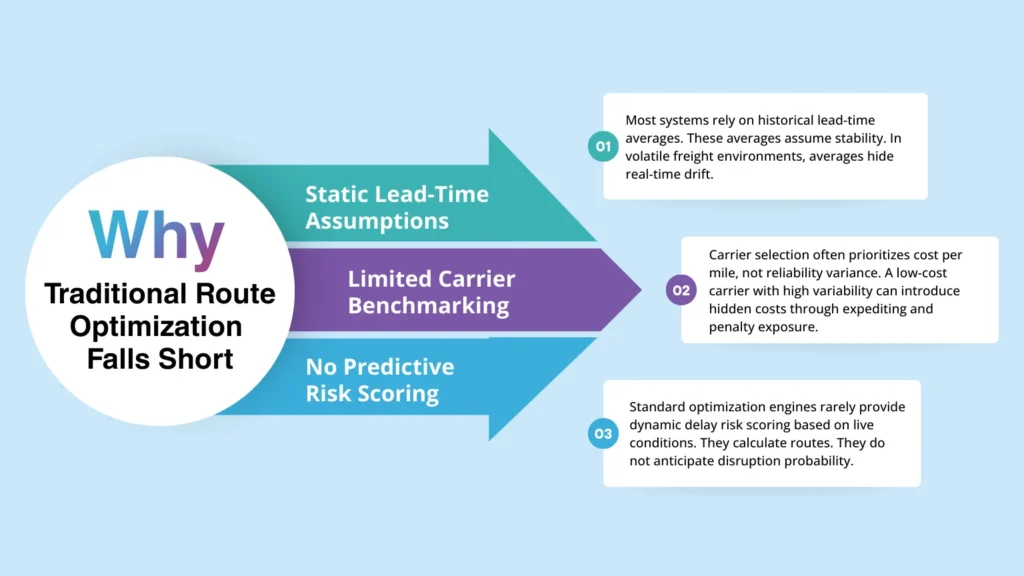
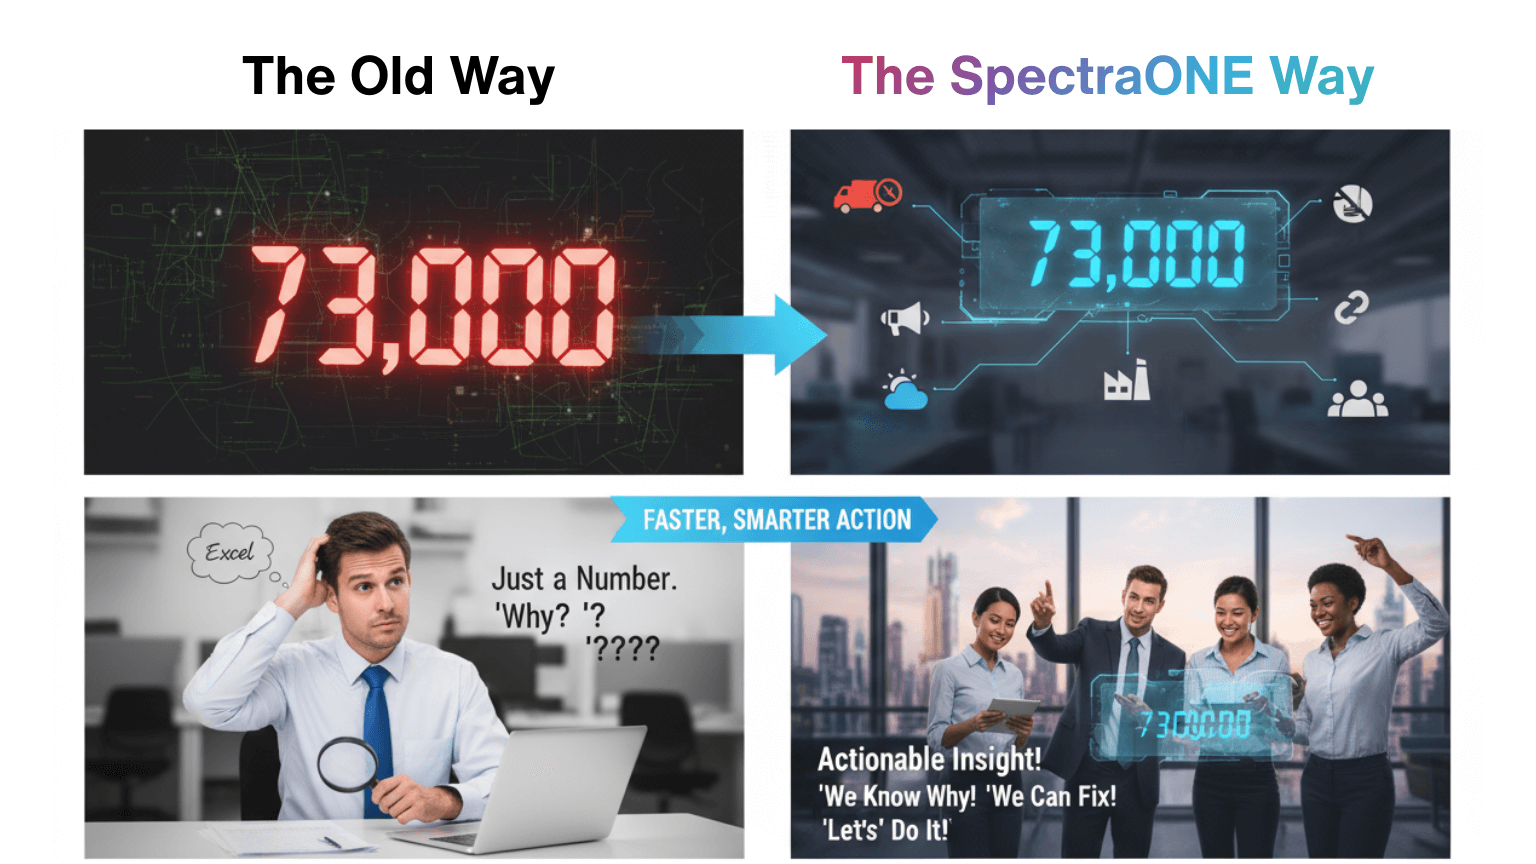
The industry spent a fortune over the last decade chasing N-Tier Visibility. Yet, simply watching a disruption happen isn’t the same as fixing it. Knowing a shipment is stuck at sea just gives your team a front-row seat to an inevitable stockout. If you want to protect your margins, you have to move past basic tracking. You need a system that can actually intervene across corporate boundaries.
What is Multi-Enterprise Orchestration
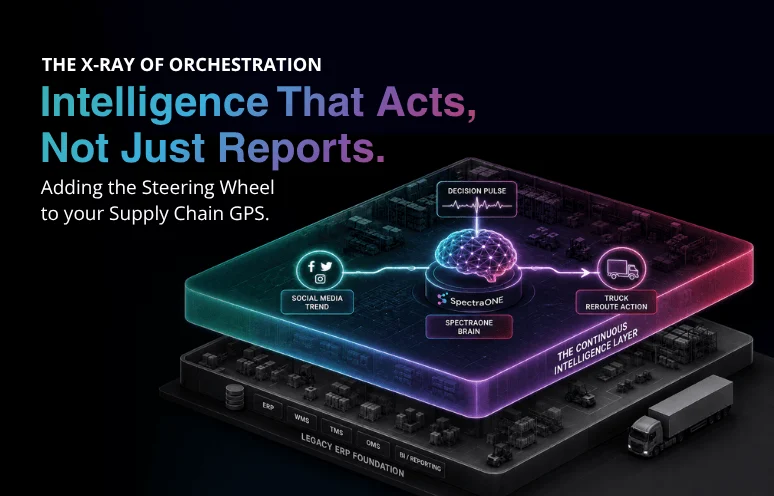
Think of multi-enterprise orchestration as an automated logic layer that coordinates decisions across completely separate companies.
Your legacy ERP handles what happens inside your own building. Multi-enterprise orchestration handles the messy handoffs between you, your suppliers, your contract factories, and your logistics providers. When something breaks upstream, this layer calculates the downstream impact on your inventory levels and immediately changes purchase orders, production queues, and shipping routes across your entire external network simultaneously.
What is Multi-Agent Orchestration
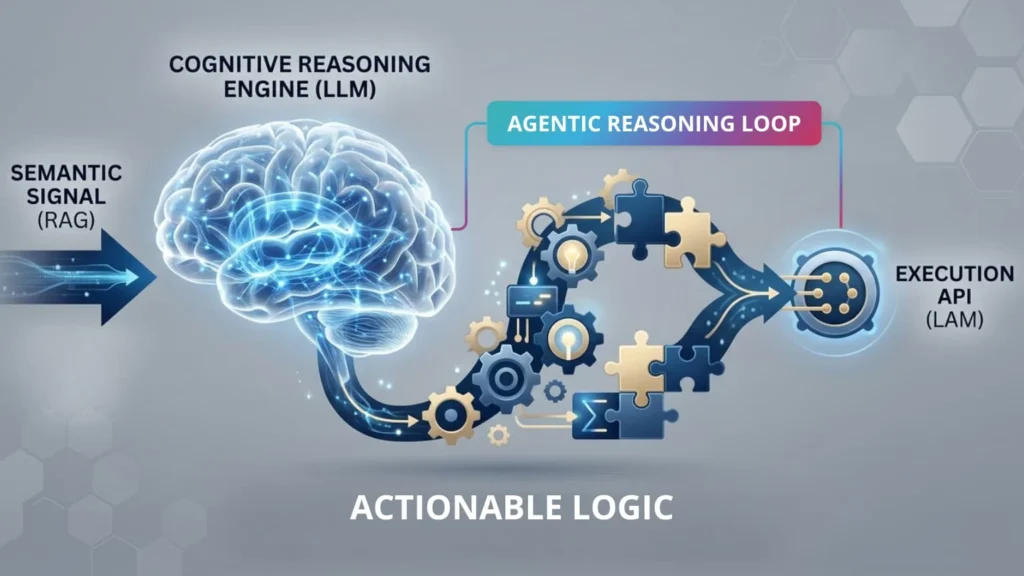
Don’t confuse Multi-Enterprise Orchestration business outcome with Multi-Agent Orchestration. That is the actual software architecture running under the hood.
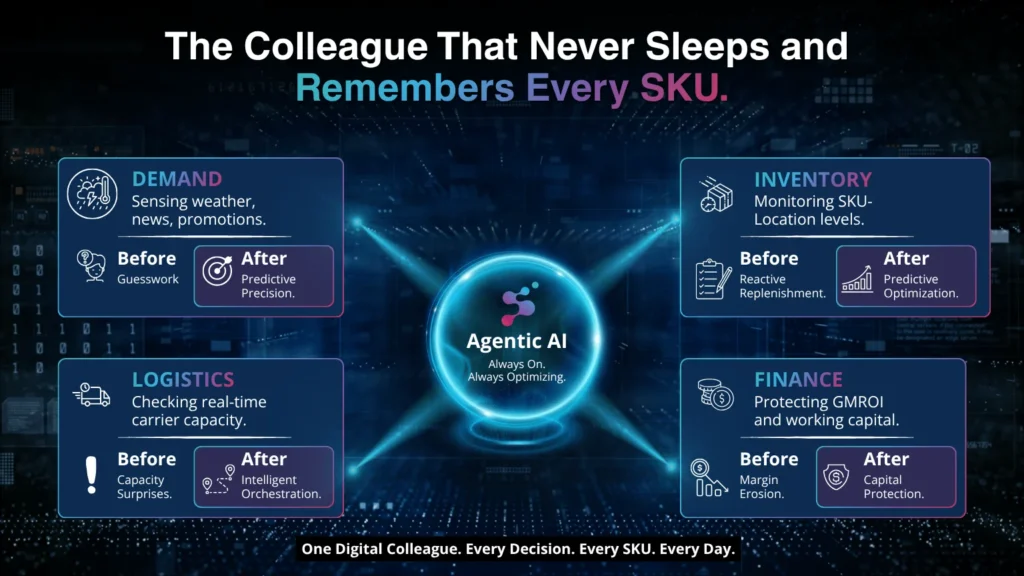
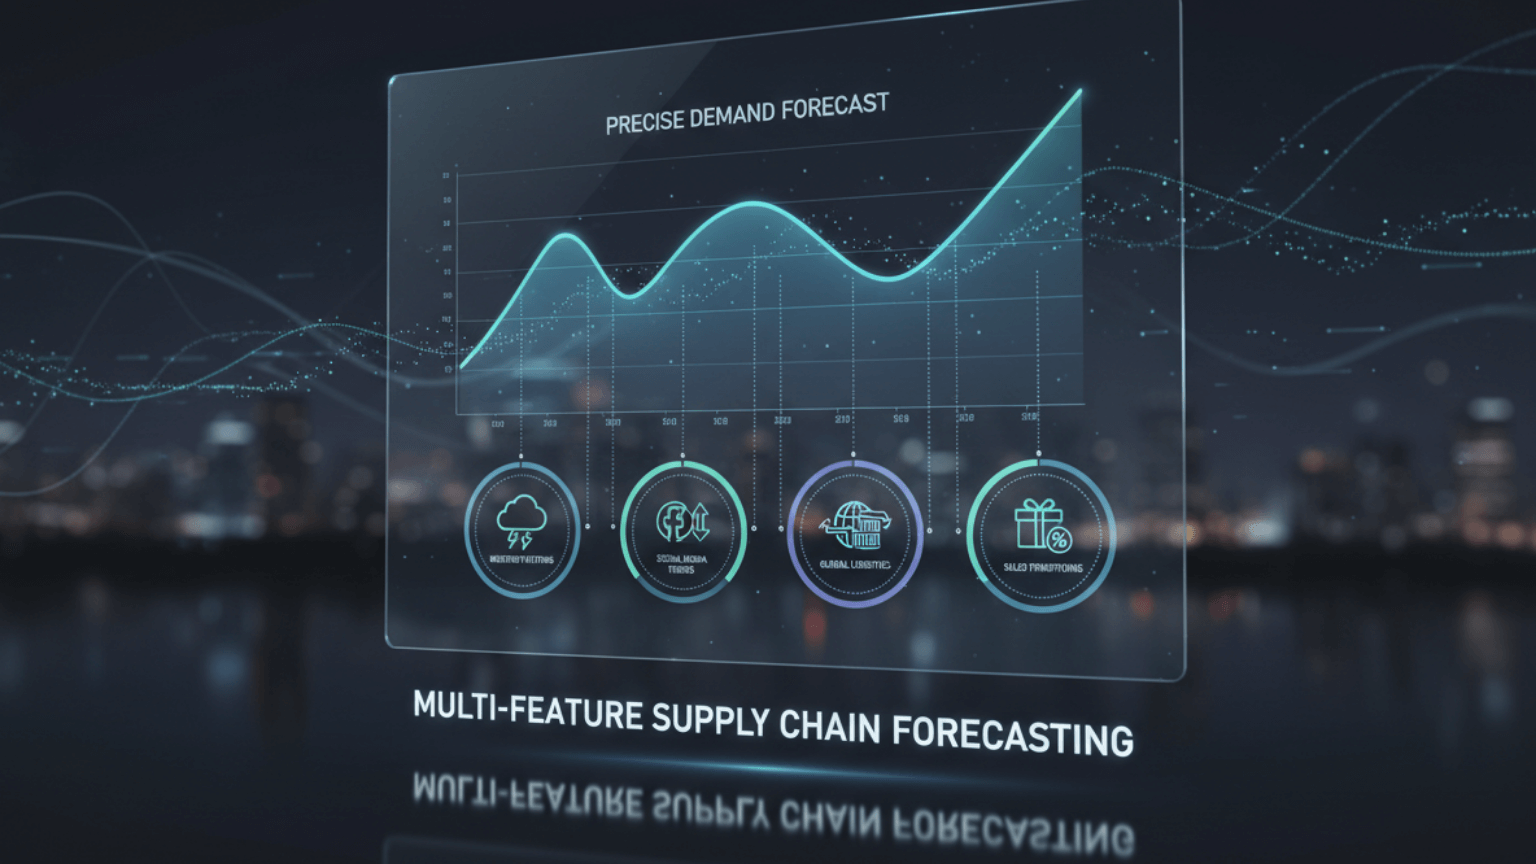
Instead of using one massive, slow software program to solve an operational problem, a multi-agent framework deploys a network of small, highly specialized digital “agents.” Each agent has one job. One tracks port wait times, another watches factory capacity, a third audits warehouse space, and a fourth monitors carrier pricing.
These digital workers don’t sit in silos. They constantly talk, negotiate, and swap data with each other in milliseconds to solve multi-variable problems. Multi-agent architecture is the technical engine; multi-enterprise orchestration is the external network of companies that the engine keeps in sync.
The Economics of Upstream Failure
To strip away the IT jargon, look at this through a simple, everyday operational lens:
A school cafeteria is preparing 500 meals for a hard noon deadline.
Your primary partner is the local bakery that delivers the bread rolls every morning (Tier 1).
The bakery relies on a regional mill for its flour (Tier 2).
The mill relies on a farming cooperative to harvest the wheat (Tier 3).
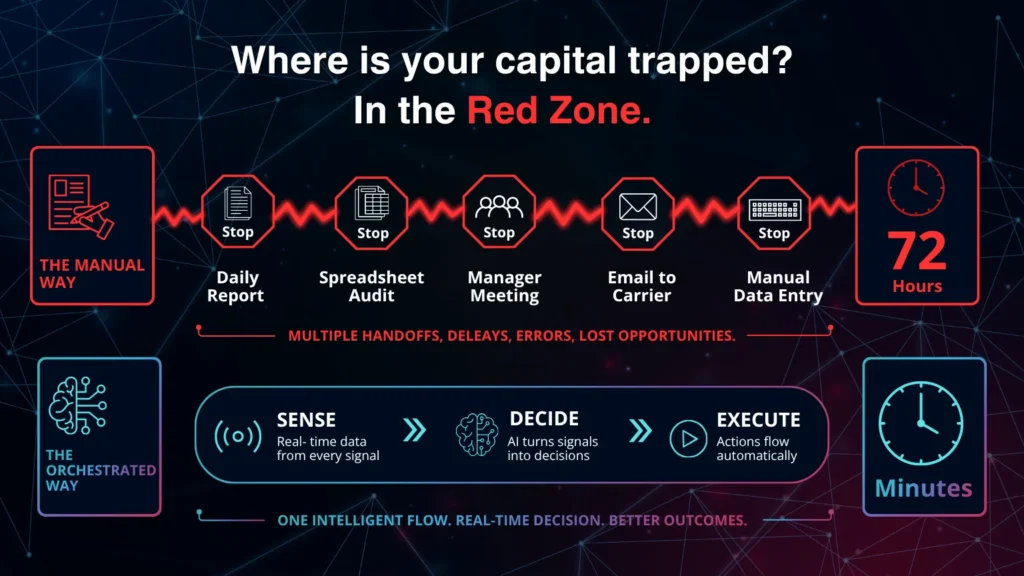
If you run a standard visibility setup, you might get an automated email at 6:00 AM stating that a severe storm has halted the wheat harvest. The data is perfectly accurate. But you still don’t have lunches for 500 people. The bakery is about to run out of flour, and your team is facing hours of frantic phone calls, manual spreadsheet overrides, and emergency menu pivots.
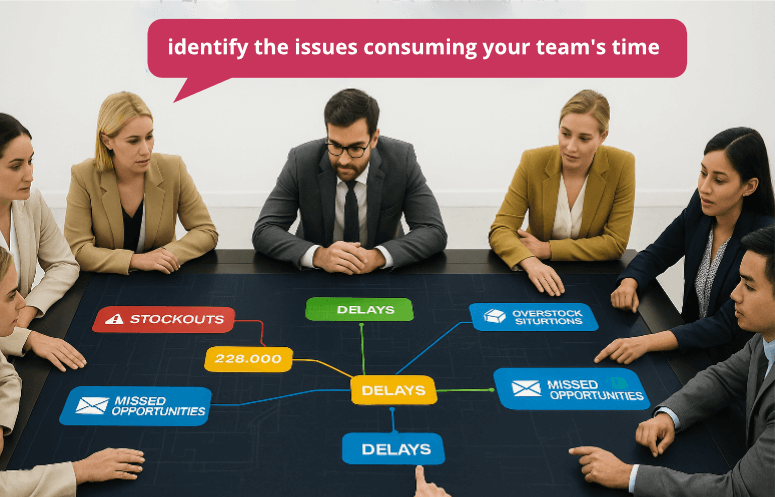
For a second, stop and audit your current workflow.
- When a sub-tier component fails in your actual supply chain, how long does it take for your planners to find out?
- Do you catch it at the source, or do you inherit the crisis days later when a critical delivery simply fails to show up at your warehouse dock?
- Who pays for the labor hours spent hunting down alternatives?
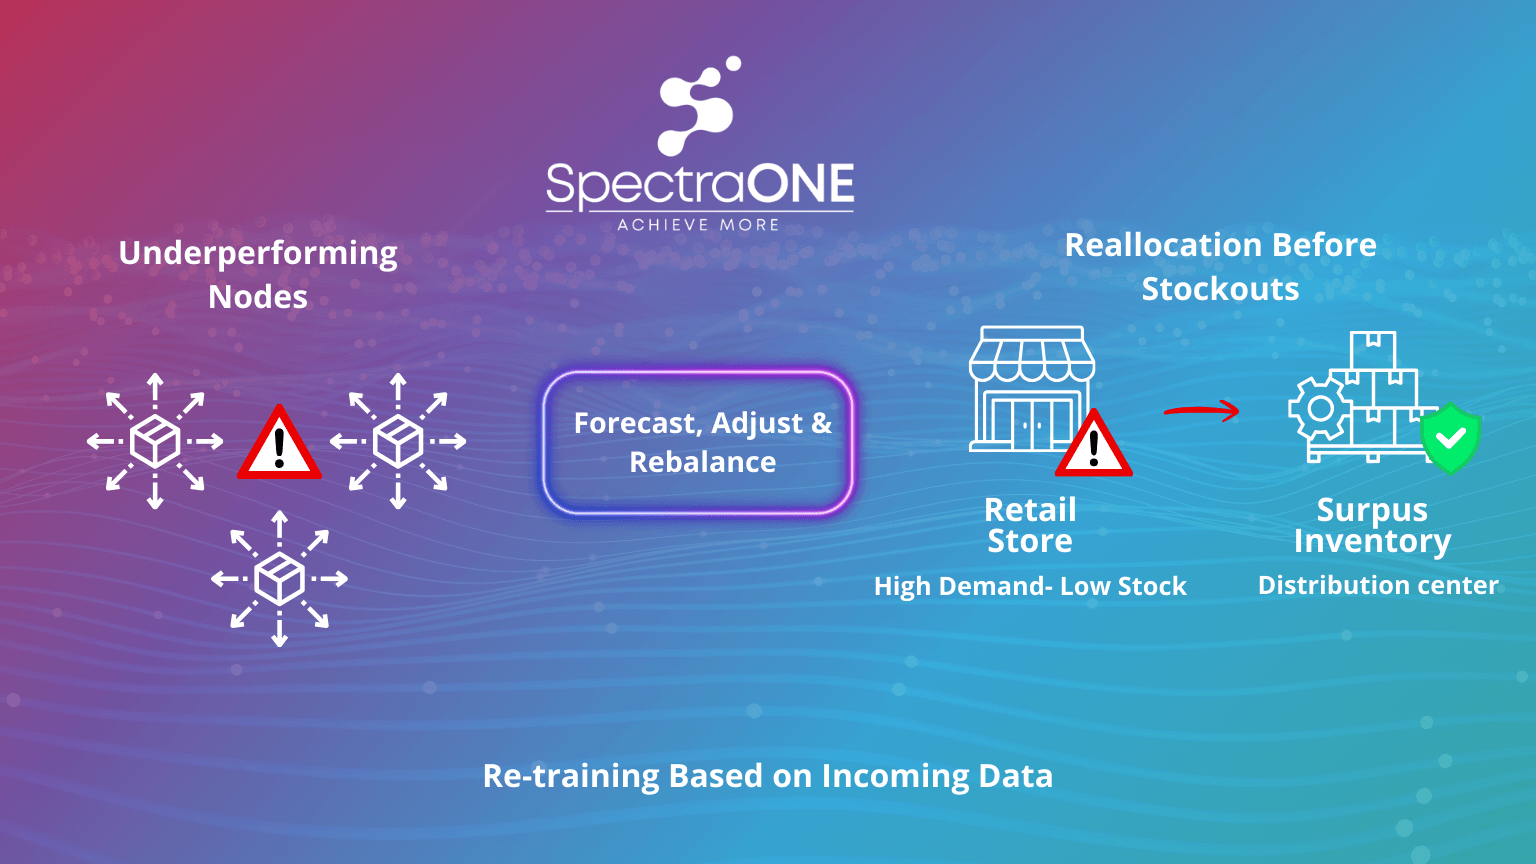
An orchestrated system, backed by a multi-agent engine, completely changes this timeline. The moment the storm hits the fields, the Supply Monitoring Agent flags the harvest delay. It doesn’t just alert a human; it immediately passes the data to the Production Agent, which calculates how long the bakery can run on its current flour reserves. Simultaneously, the Sourcing Agent scans regional suppliers, finds a mill with unallocated safety stock, and reroutes a backup flour order to the bakery.
The cafeteria experiences zero downtime because the software agents negotiated a fix across three separate businesses before your primary supplier’s production line ever ground to a halt.
Overcoming the Data Sharing and Privacy Deadlock
This level of deep network connectivity always hits a major roadblock:
Why on earth would a third-party supplier give you access to their private operational data?
It is a completely reasonable objection.
Upstream vendors protect their internal numbers. They worry that total transparency will give you too much leverage during price negotiations or expose their own internal operational flaws during contract renewals. If you asked your current manufacturers for a live, unedited look at their sub-vendor capacity logs today, you would likely spend 6 months locked in data privacy legal reviews.
We bypass this deadlock through a signal-based architecture called the Digital Handshake. The platform doesn’t require direct integration with a supplier’s core database; instead, it hooks into secure, encrypted connection points that exchange specific operational pulses rather than raw commercial records.
Your vendors keep their data private; they simply broadcast automated availability signals and lead-time variations specific to the SKUs you buy.
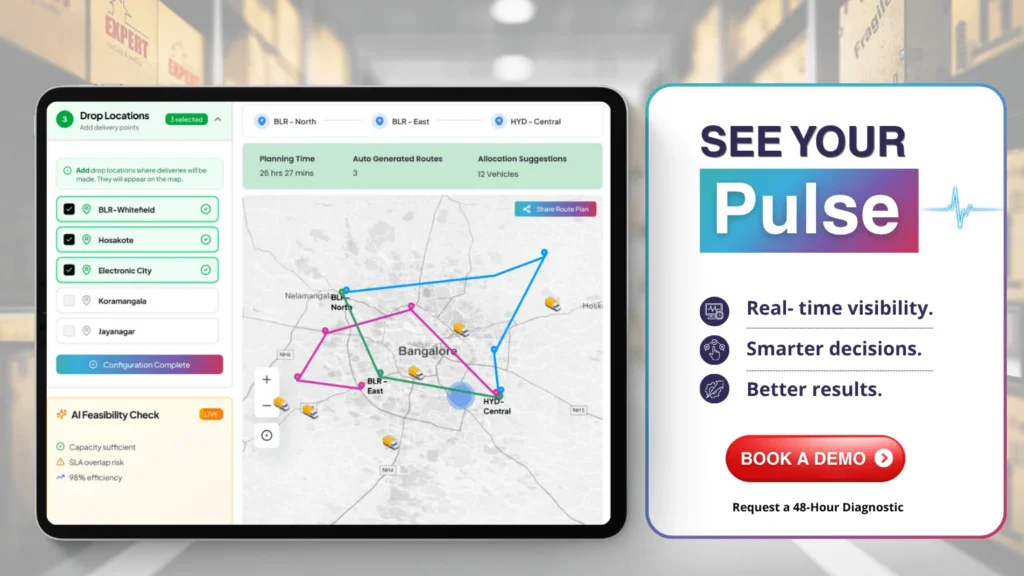
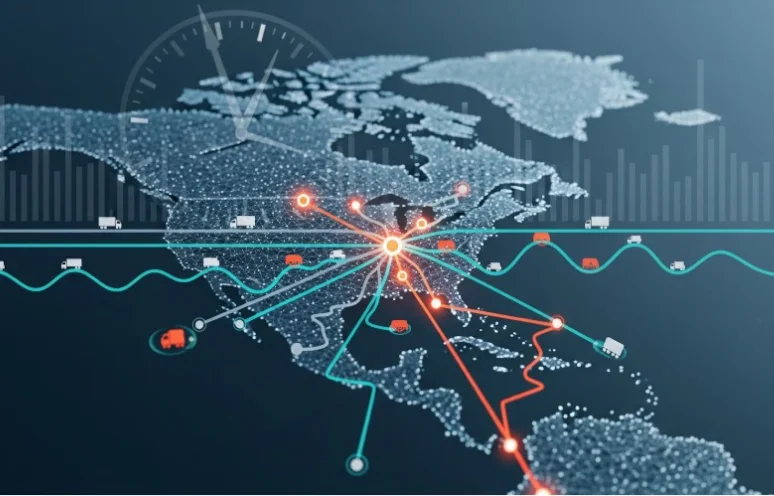
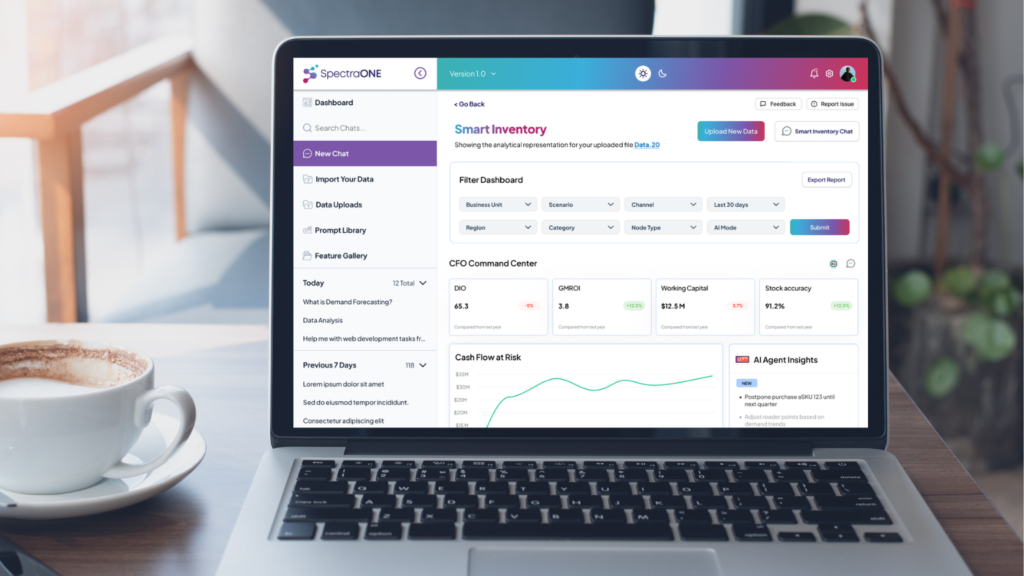
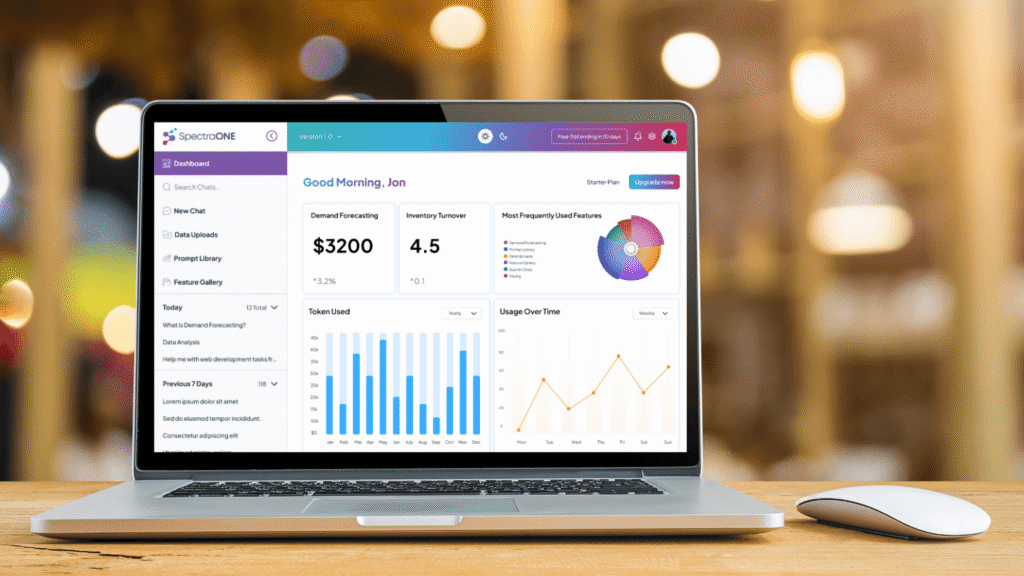
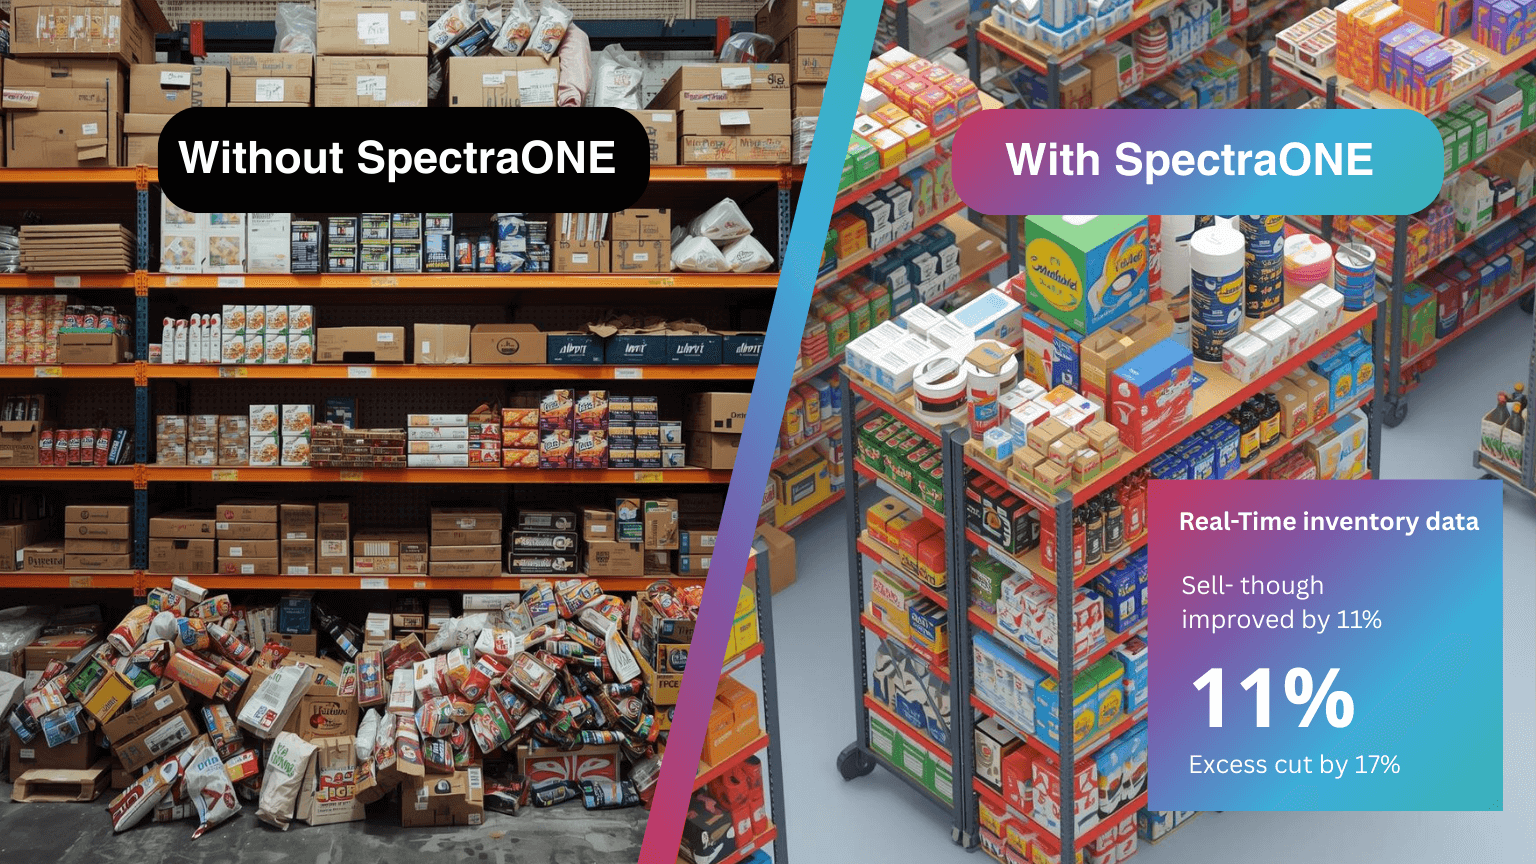
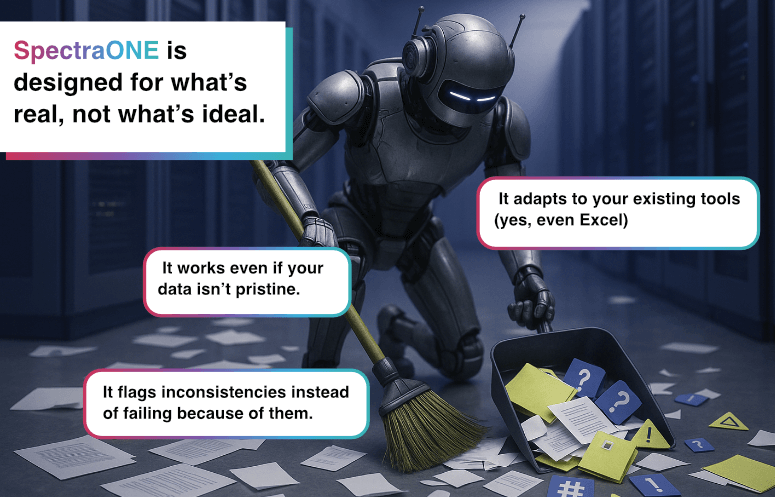
By deploying a platform like SpectraONE as an independent layer, you can monitor ETA Variability across organizational borders. The handshake ensures that when an exception threshold is crossed, the multi-agent system runs a pre-mapped backup plan without forcing either company to expose their sensitive business secrets.
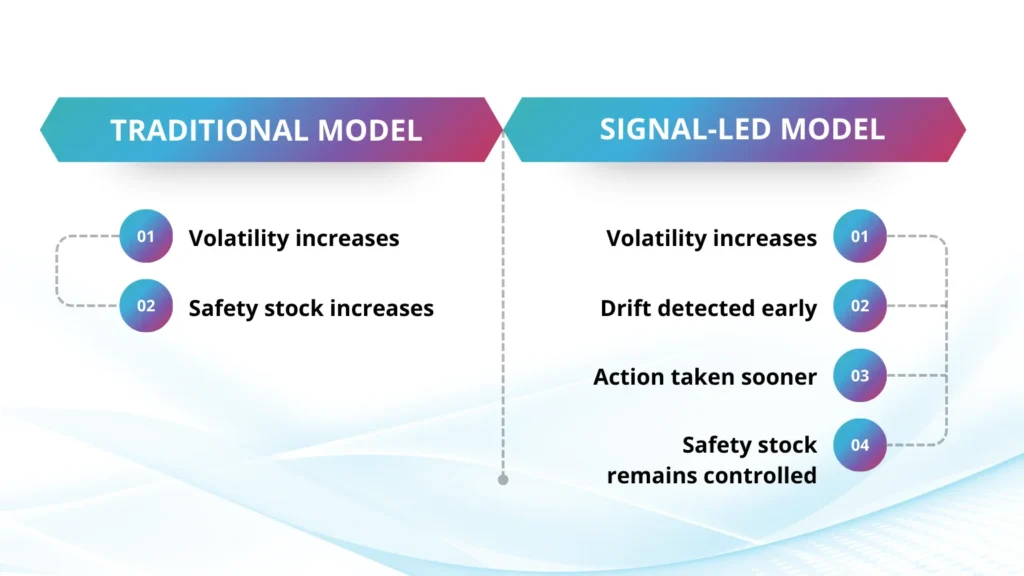
Replacing Buffer Inventory with Continuous Material Flow
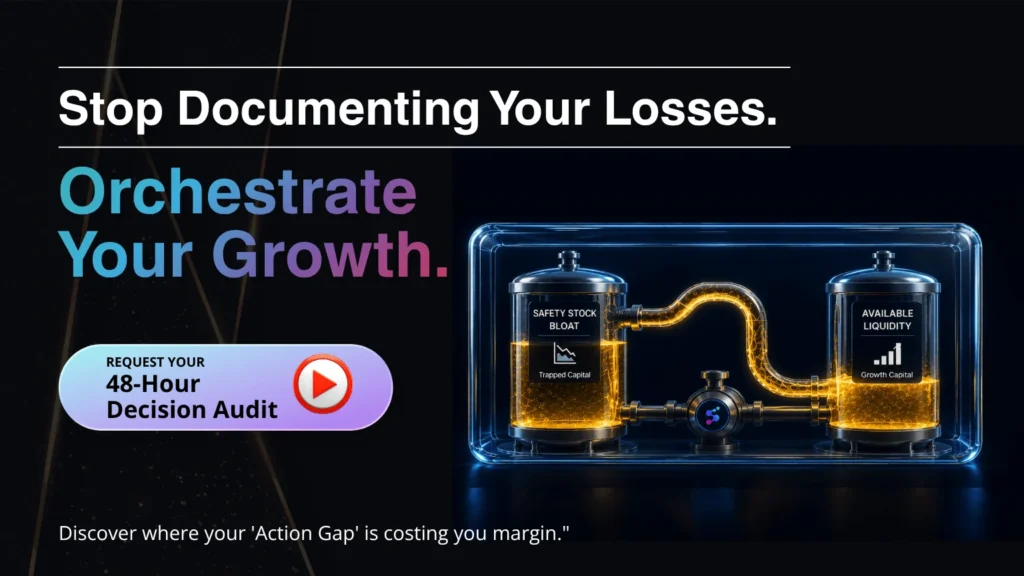
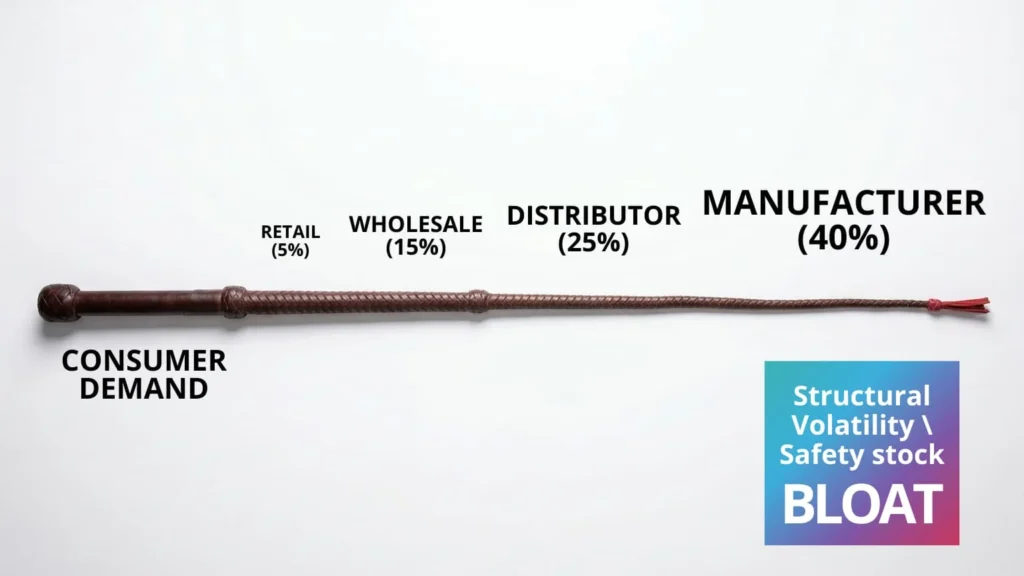
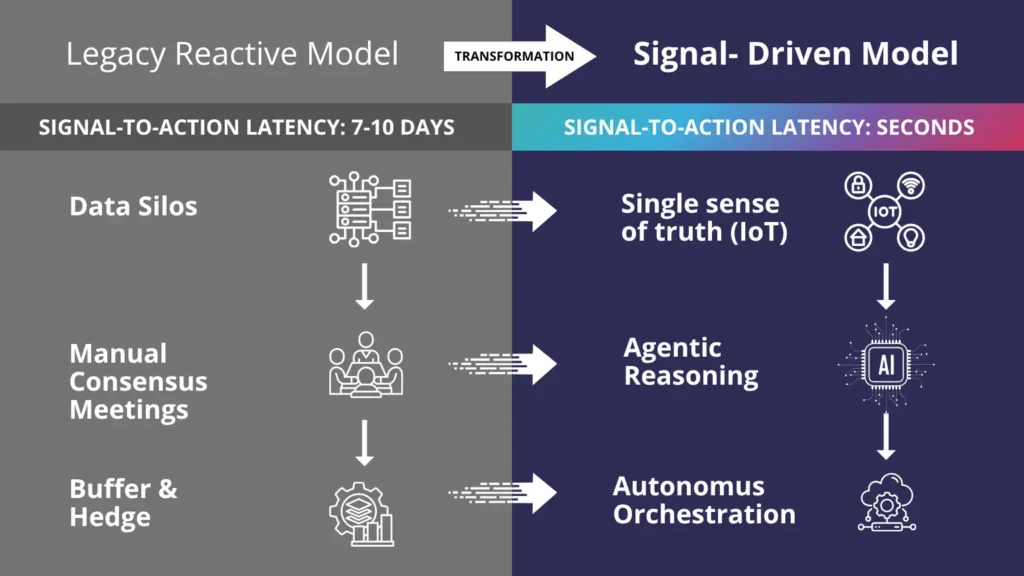
The ultimate goal of orchestrating an extended supplier base is continuous, uninhibited material flow. When your deep-tier risks are handled by an Agentic AI layer, you can systematically draw down the bloated safety stock cushions that quietly drain capital from your balance sheet.
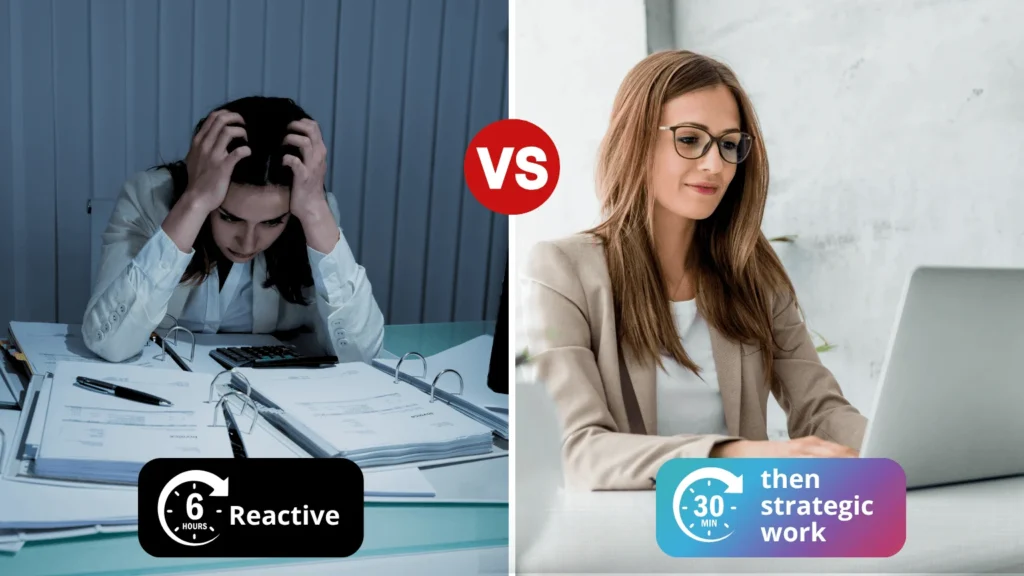
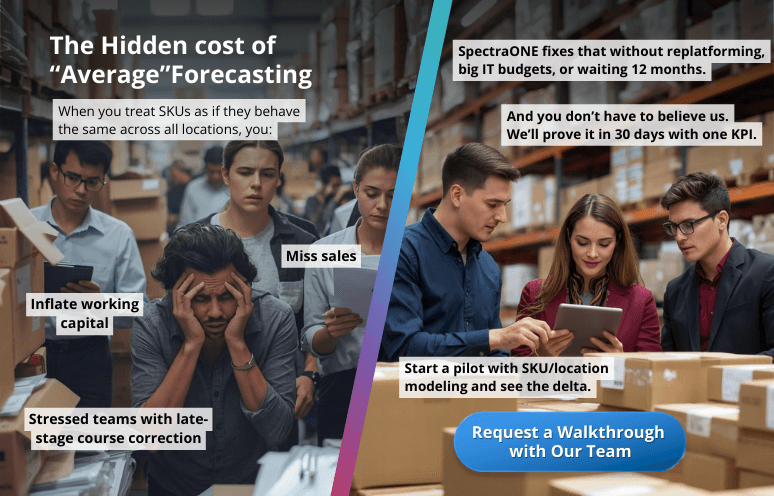
Companies who relying on static dashboards remain fundamentally reactive, documenting logistics failures after they have already damaged quarterly performance. Actual competitive advantage belongs to the operations teams that can out-execute the delay itself.
How much cash is currently trapped in your inventory buffers simply because your software can’t execute an action without a human clicking ‘approve’?
Long-term profitability in a volatile global market isn’t about the sheer volume of data you collect. It depends entirely on the Decision Velocity you can apply to your entire multi-enterprise network.