The 2026 Bullwhip: Why Agentic AI is the Final “Shock Absorber” for Supply Chains

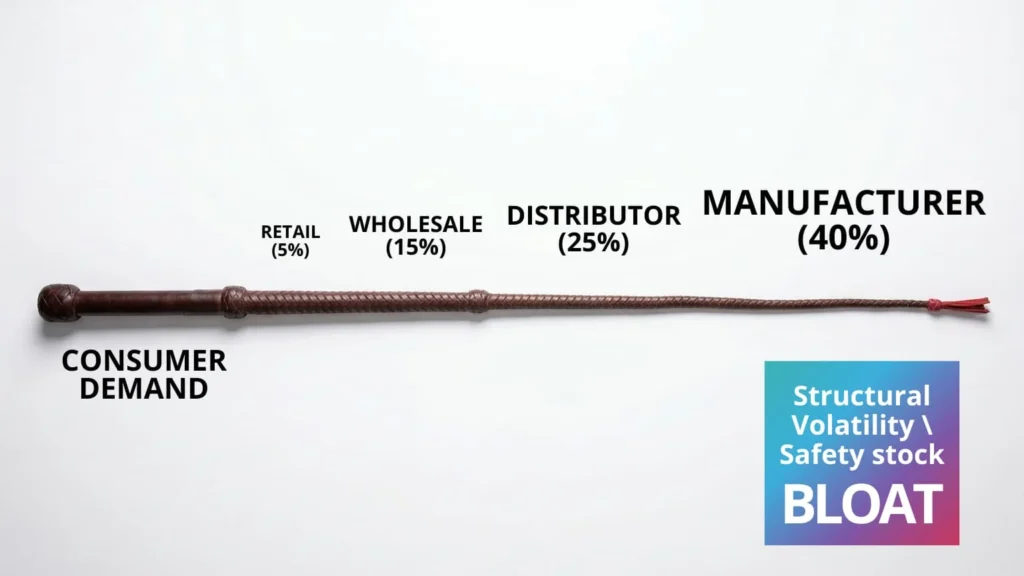
In supply chain circles, the “Bullwhip Effect” is often treated like the weather, something we talk about constantly but assume we cannot control. Historically, a 5% swing in retail demand has reliably translated into a 40% panic at the manufacturing plant.

1

Despite the digital transformation of the 2010s, this phenomenon has only intensified in 2026 as consumer behavior becomes more fragmented across social and digital channels.

At SpectraONE, we have observed that while companies have better data than ever, the bullwhip is actually a reasoning problem, not just a data problem. Here is how we are using LLM-based Agentic AI to finally dampen the whip.

The “Information Echo” Problem

The bullwhip effect is essentially a global game of “telephone.” Let’s understand this with an example.

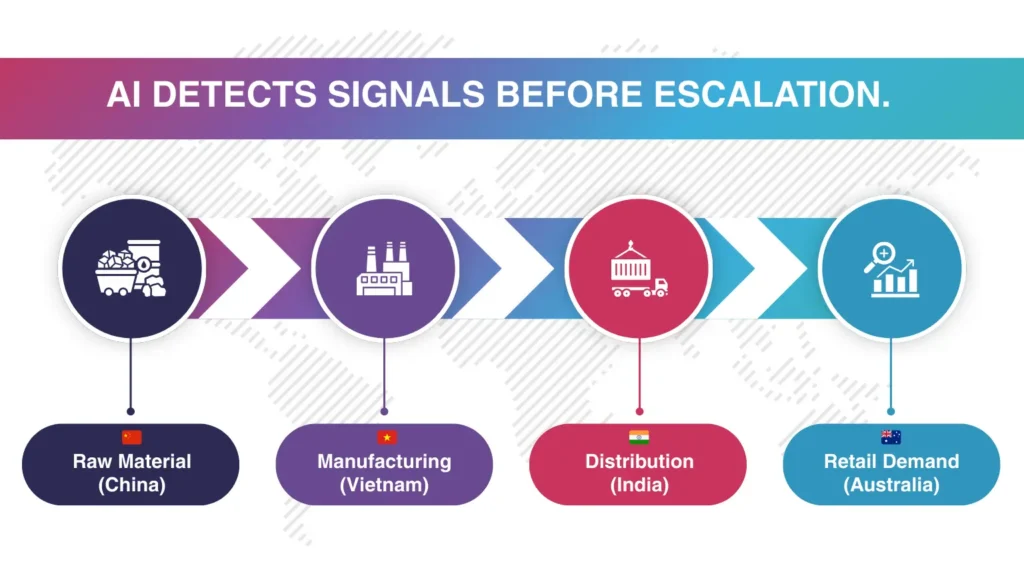
Imagine a viral social media trend suddenly triples the demand for a specific oat milk brand in the US Midwest.

The 2026 Bullwhip Why Agentic AI is the Final Shock Absor- Blog

To a local grocer, it’s a one-week stockout. But as that signal travels upstream (unverified and lacking context) the distributor 2X their safety stock, and the processing plant authorizes a massive new production run. 

By the time the extra inventory arrives next month, the trend will have vanished, leaving the manufacturer with a warehouse full of expiring goods.

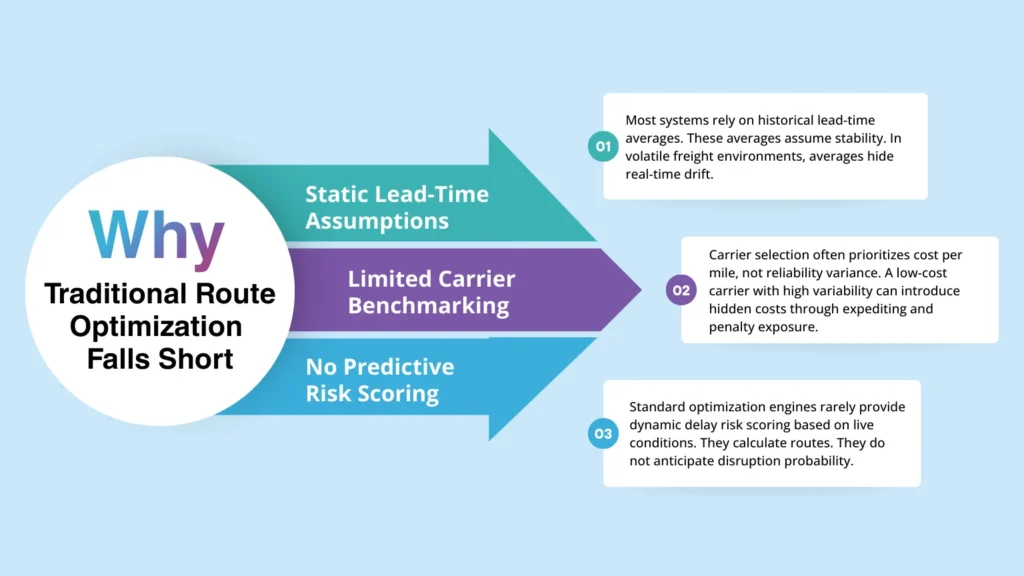
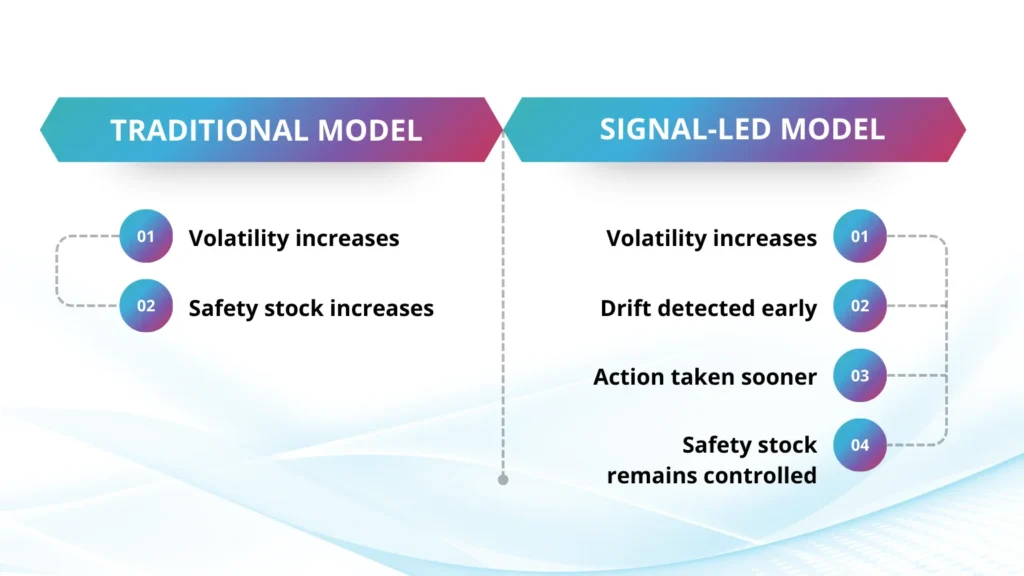
Traditional ERP and APS (Advanced Planning and Scheduling) systems actually worsen this. They are programmed with static safety stock formulas that react to historical variance. As we noted in our recent deep dive on Safety Stock Bloat, this leads to a quiet expansion of working capital that kills margins.

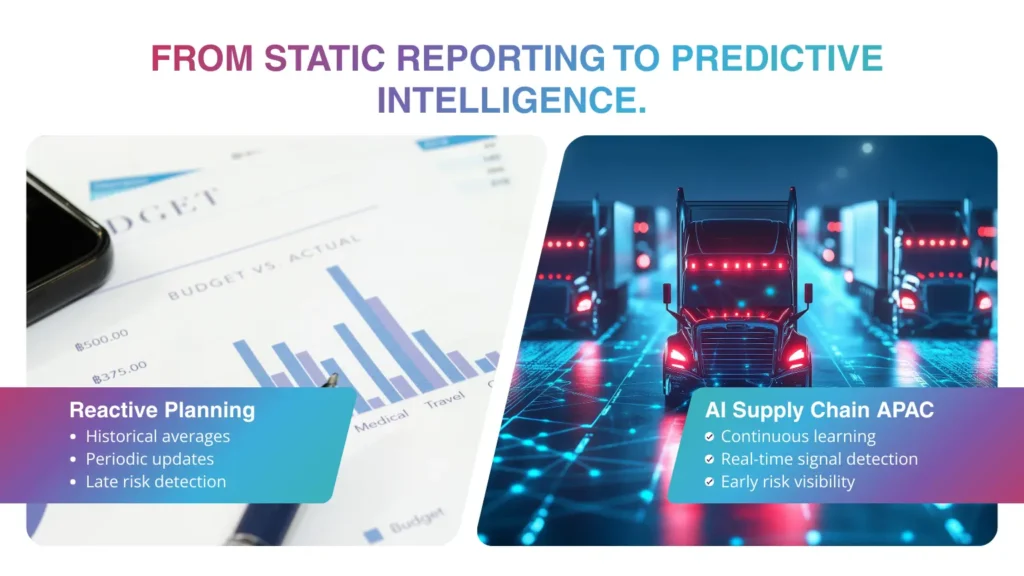
The Human vs. The Agent: Two Different Worlds

In 2026, the differentiator isn’t how much data you have; it’s how quickly you can reason through it.

1. The Human Planner: The “Hedge and Hope” Strategy

When a human planner sees a disruption, let’s say an ETA delay at a major port, their natural instinct is to over-correct. They lack the cognitive capacity to instantly calculate the downstream impact on 500 different SKUs across 12 distribution centers.

They manually increase the next three Purchase Orders (POs) by 15% “just in case.” So, the result is that this localized “safety” creates a massive inventory glut four months later when the port clears.

2. SpectraONE’s Agentic AI: The “Orchestrated Dampening” Strategy

An LLM-based agent doesn’t just look at a spreadsheet; it uses stochastic reasoning to understand the context of the signal. Our agents are built on a Multi-Agent System (MAS) architecture that functions like a digital brain. It breaks down the problem through multi-step reasoning.

2

The Sensing Agent: Detects a 10% lift in a specific region using multi-feature signals (weather, social sentiment, and local holidays).

The Reasoning Agent: Uses context-aware logic to ask: “Is this lift a trend or a fluke?” It cross-references the lift with recent promotion breakdowns to determine whether demand is cannibalized from a future week.

The Execution Agent: Instead of ordering 15% more for everyone, it autonomously negotiates a “micro-shift” in existing stock between two regional DCs and prepares the trigger for the ERP.

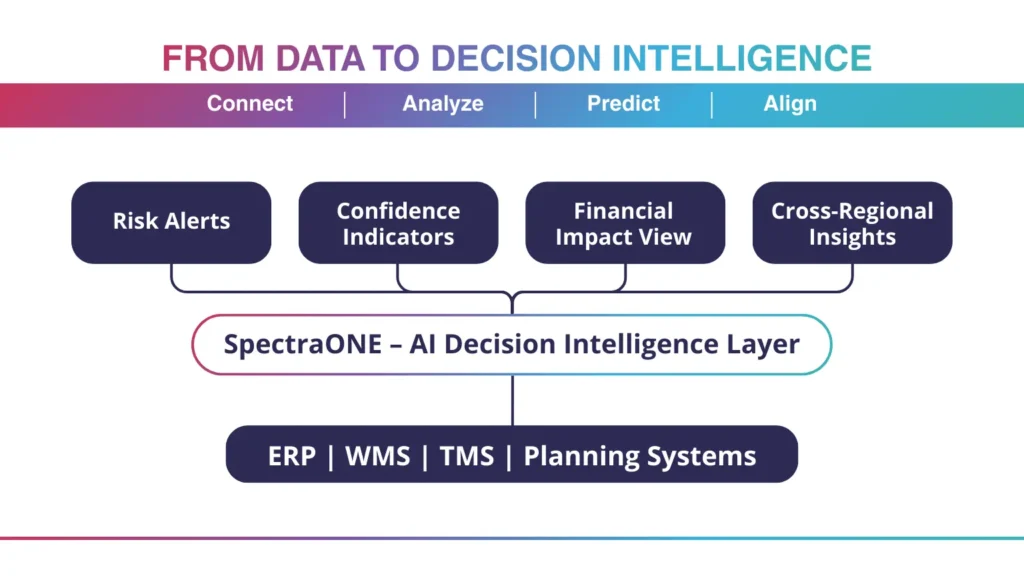
Technical Depth: Context-Aware Decision Support

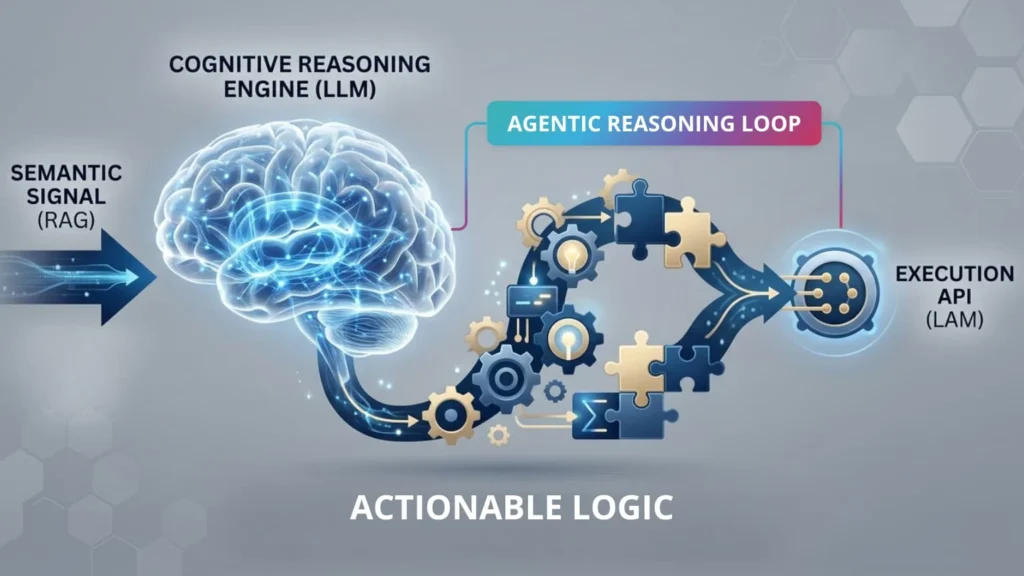
A common misconception is that Large Language Models (LLMs) are being asked to solve the math of the supply chain. In the SpectraONE architecture, the LLM isn’t the calculator; it’s the Contextual Interpreter.

We have unified Retrieval-Augmented Generation (RAG), Digital Twins, and Optimization Engines into a single cohesive narrative:

  1. Context (LLM and RAG): The system “reads” the context of a disruption (e.g., a news report on a regional carrier strike).
  2. Simulation (Digital Twin): The agents ask the Digital Twin, “What is the projected impact if this specific node is delayed by 72 hours?”
  3. Calculation (Optimization Engine): The engine computes the numerical adjustments needed to maintain service levels.

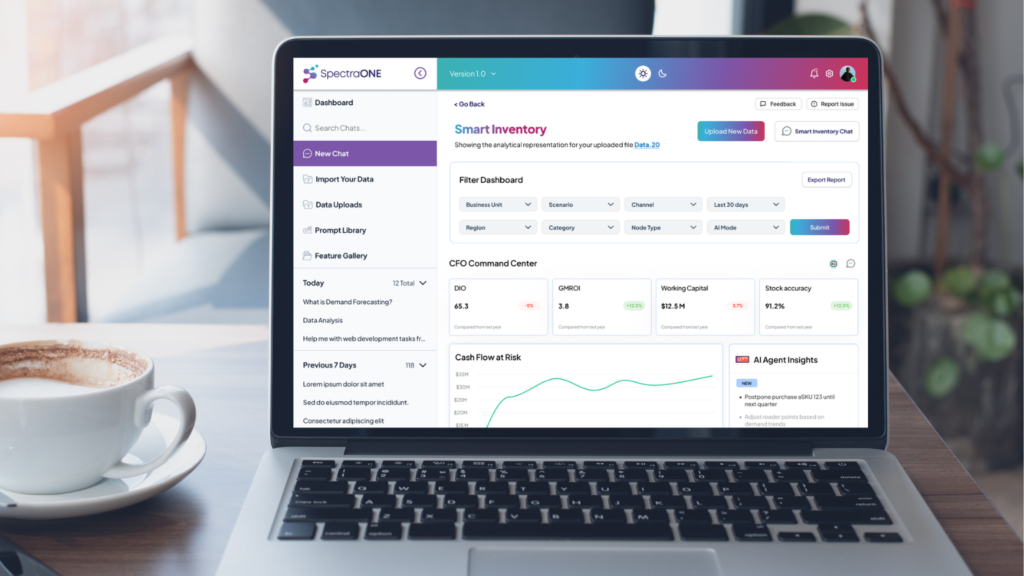
SpectraONE agents can explain why they are dampening a signal. This “Explainable AI” is critical; according to 2026 industry benchmarks, 74% of AI implementations fail because planners don’t trust the “black box” (Source: SpectraONE – Why Most AI Tools Fail). 

SpectraONE provides a business-ready narrative: “I am recommending no increase to the PO because the current demand spike is highly correlated with a 3-day heatwave, not a structural shift in consumer preference.”

The Financial Impact: By the Numbers

The shift from reactive planning to agentic orchestration has measurable ROI. Recent 2025/2026 case studies in the FMCG and Retail sectors show that dampening the bullwhip via Agentic AI leads to:

Reduction in Excess Inventory by eliminating the “just in case” manual overrides that plague human planners.

Improvement in OTIF (On-Time In-Full) by sensing shortages 7–10 days earlier than traditional ERP systems (Source: Logistics Management 2026 Trends).

Reduction in Expedited Shipping Costs because the “panic” phase of the bullwhip is caught at the source, preventing the need for last-minute, high-cost logistics.

Moving to “Signal-to-Action” Parity

The-2026-Bullwhip-Why-Agentic-AI-is-the-Final-Shock-Absor-Blog-1

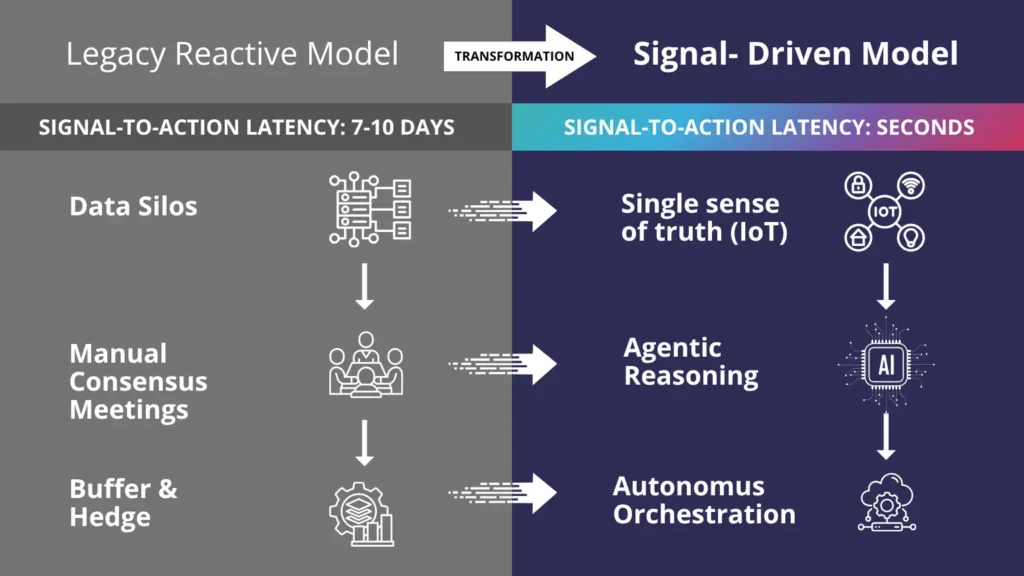
In 2026, the goal of a world-class supply chain is to achieve Signal-to-Action Parity. It means the moment a product is scanned at a retail checkout, the entire upstream supply chain from the DC to the raw material provider adjusts its expectations in unison.

SpectraONE’s SKU-Location forecasting ensures that this signal is accurate at the most granular level, while our agentic layer ensures that the reaction to that signal is measured, logical, and profitable.

Conclusion

The bullwhip effect is not an inevitability; it is a symptom of disconnected reasoning. While traditional tools gave us the data to see the wave coming, SpectraONE’s Agentic AI gives you the power to break the wave before it hits the factory floor. It is an Operational Intelligence and Execution system. 

We provide the brain that interprets the signal and the framework to execute the response. As we look toward the remainder of 2026, the market winners will be the companies that stop fighting the bullwhip and start dampening it through autonomous, intelligent orchestration.

AI Supply Chain APAC: Turning Regional Complexity into Predictable Performance

The Asia-Pacific region is one of the most complex supply chain environments in the world. Production may sit in one country, suppliers in another, and demand scattered across several fast-moving markets. Add currency shifts, port congestion, regulatory variation, and promotional volatility, and even well-run networks can feel fragile.

This is why conversations around AI supply chain APAC adoption are becoming more practical and less theoretical.

Leaders aren’t asking whether AI sounds innovative. They’re asking whether it helps them avoid the next disruption.

The Reality of APAC Supply Networks

AI detects signals

APAC supply chains are deeply interconnected. A raw material delay in China can quietly affect manufacturing in Vietnam. A demand spike in India can distort regional inventory planning. Often, the signals appear small at first — a slight increase in order frequency, a minor lead-time stretch, a subtle shift in channel mix.

Traditional systems capture the data. They just don’t always connect it early enough.

Most enterprises already have ERP systems, reporting dashboards, and planning tools. The issue isn’t visibility. It’s an interpretation. By the time risks are obvious in reports, they’ve usually already impacted service levels or working capital.

AI supply chain APAC strategies focus on identifying these early patterns — before they become operational emergencies.

Why Forecasting Alone Isn’t Enough

Static vs Predictive Intelligence

Forecasting is often where improvement begins. In many APAC markets, demand patterns don’t behave consistently year over year. Growth can be sharp but uneven. Promotions distort baseline trends. Urban consumption shifts quickly. Relying purely on historical averages creates instability.

AI-driven forecasting models learn continuously. They adjust as patterns shift instead of waiting for the next planning cycle. Over time, this reduces the gap between planned and actual demand. But forecasting is only one part of the equation.

AI supply chain APAC platforms extend beyond demand numbers. They correlate supply variability, production constraints, and logistics performance. When signals move in different parts of the network, AI can surface connections that manual reviews might miss.

This changes how teams respond. Instead of reacting to shortages, they anticipate them. Instead of expediting shipments, they rebalance earlier.

Cross-Border Complexity Requires Connected Intelligence

One defining characteristic of APAC operations is geographic spread. Few enterprises operate within a single national boundary. Most manage multi-country networks, each with its own regulatory requirements and infrastructure reliability.

Without connected intelligence, planning becomes siloed. Regional teams optimize locally, sometimes at the expense of the broader network.

AI supply chain APAC solutions create a unified analytical layer. They help organizations see how decisions in one country influence performance in another. This improves coordination and reduces unintended ripple effects.

For enterprises managing multiple markets simultaneously, this broader perspective is critical.

Trust and Explainability Matter

Adopting AI in enterprise environments is not just about model accuracy. It is about trust.

Planners and operations leaders need to understand why a system is recommending a change. If the logic is opaque, resistance follows.

Explainable AI addresses this directly. When a forecast shifts, the system should indicate what’s driving it, whether it’s order frequency, supply delays, or channel variation. Confidence indicators help teams judge how aggressively to respond.

In APAC organizations, where decisions often involve multiple stakeholders, clarity speeds alignment.

AI supply chain APAC transformation works best when it supports human judgment rather than attempting to replace it.

Where SpectraONE Comes In

AI Decision Intelligence Layer

SpectraONE supports enterprises pursuing AI supply chain APAC initiatives by acting as a decision intelligence layer across existing systems.

Instead of replacing ERP or planning tools, SpectraONE connects demand, supply, inventory, production, and logistics signals into one continuous analytical view. It monitors patterns, flags emerging risks, and provides contextual insight into potential operational and financial impact.

For companies operating across multiple APAC markets, this reduces blind spots and shortens response time.

The objective isn’t to generate more data, but to bring clarity to it.

The Competitive Shift

APAC will likely remain one of the most dynamic supply chain environments globally. Growth will continue, but so will volatility.

Enterprises that depend solely on historical reporting will find themselves reacting more often than planning. Those investing in AI supply chain APAC capabilities gain a structural advantage: earlier detection, stronger coordination, and more confident execution.

In a region where small disruptions can cascade quickly, foresight becomes more valuable than hindsight.

Frequently Asked Questions

What does AI supply chain APAC mean?

It refers to the use of artificial intelligence to improve forecasting, risk detection, and operational decision-making across supply chains operating in the Asia-Pacific region.

How does AI improve supply chain resilience in APAC?

AI analyzes real-time demand and supply signals to detect emerging risks early, enabling proactive adjustments before disruptions escalate.

The objective isn’t to generate more data, but to bring clarity to it.

Yes. While large enterprises benefit significantly, mid-sized companies operating across multiple countries can also improve forecasting and inventory efficiency through AI-driven planning.

Why ETA Variability Is the Real Cost Driver in Logistics

The Hidden Cost of Delivery Variability in North American Supply Chains

If your routes are optimized but your costs keep spiking, distance is no longer your real problem.

North American shippers have squeezed most of the waste out of mileage and routing. Yet OTIF penalties, expediting, and buffer inventory continue to rise. The gap is not in how shipments are routed, it’s in how reliably they arrive. ETA variability has quietly become the dominant risk variable in modern logistics, and most planning systems still treat it as an afterthought.

Across North America, freight markets have undergone structural volatility over the past five years. Spot rate swings, port congestion, labor shortages, and capacity shifts have reshaped logistics planning.

According to the American Trucking Associations, trucking alone moves over 72% of U.S. freight by weight. Meanwhile, supply chain disruptions between 2020 and 2024 exposed the fragility of delivery predictability. Most organizations responded by investing in route optimization tools, and it works to a point; it reduces distance, fuel cost, and basic routing inefficiencies. 

But here’s the operational truth: route optimization solves geometry, and it does not solve variability.

Why Distance Is No Longer the Primary Risk Variable

Traditional logistics systems optimize for the shortest path, the lowest cost route, and pre-defined constraints. However, modern logistics volatility is rarely driven solely by distance. It is driven by variability in carrier performance, port congestion, border delays, weather anomalies, capacity bottlenecks, and regulatory inspections.

When variability increases, even the most optimized route fails to deliver predictably. This leads to late OTIF penalties, expedited freight, customer dissatisfaction, reactive re-planning, and higher upstream buffer inventory.

According to studies, companies with limited supply chain visibility experienced 2–3x more disruption-related cost exposure during recent volatility cycles. The issue is not route length; it is signal timing.

The Operational Impact of ETA Variance

Traditional systems update ETAs after the delay becomes visible. By then, response options are limited.

Route Optimization Isn’t Enough Why Variability Not- Blog

ETA accuracy directly influences production scheduling, warehouse staffing, retail shelf replenishment, cold-chain integrity in F&B, and compliance exposure in pharma. Even small ETA deviations compound downstream. 

For example:

Refrigerated freight (F&B) 

A small 6-hour delay in a refrigerated trailer’s arrival at a cross-dock can push product beyond its optimal temperature exposure window. Industry analyses estimate that 8–15% of global food loss is linked to cold-chain failures, much of it tied to timing and handling deviations rather than total transit distance.

Inbound to manufacturing 

A one-day delay on a critical raw material or component can force production planners to reshuffle lines, switch to less efficient production runs, or idle labor and equipment. In surveys of manufacturers, over 40% report that unplanned delivery delays are a top-3 driver of overtime and expediting costs, even when their routing is already optimized.

Retail distribution centers and shelf availability 

A delayed inbound truck into a retail DC can trigger shelf-level stockouts even when there is technically enough inventory in the broader network. Studies on on-shelf availability consistently show that 30–40% of stockouts are caused by upstream replenishment or inbound timing issues, not by true inventory shortages.

How SpectraONE Addresses Logistics Variability at the Signal Level

SpectraONE enhances existing TMS and ERP systems by adding a real-time intelligence layer that focuses on predictive risk and variance control. It does not replace routing engines; it strengthens decision timing.

Predictive ETA Intelligence

SpectraONE applies transformer-based pattern recognition across telemetry, carrier performance history, and contextual logistics signals.

Instead of static ETAs, teams gain dynamic variance forecasting, risk-probability scoring, and early-drift alerts. This enables proactive mitigation before delivery commitments are missed.

Carrier Performance Benchmarking Beyond Cost

SpectraONE analyzes carrier variability patterns, not just rate structures. Teams can evaluate historical delay frequency, lane-level volatility, and seasonal performance deviations. This allows selection decisions based on reliability, not only price.

Real-Time Risk and Exception Monitoring

Rather than waiting for shipment status changes, SpectraONE surfaces early warning signals tied to route congestion indicators, external market shifts and regional disruption patterns. This early signal awareness reduces the need for reactive expediting.

What Changes After Implementation

How SpectraONE Reduces Safety Stock Without Increasing Stockout Risk

Logistics and 3PL operators typically observe:

  • Improved ETA reliability
  • Reduced last-minute expediting
  • Lower penalty exposure
  • Better alignment between inbound and production schedules

More importantly, planning teams begin making routing decisions based on predicted risk rather than post-event reporting.

The Strategic Shift 

From Route Optimization to Variance Control

Traditional model
Optimize distance → React to delay.
Signal-driven model
Predict variability → Adjust before delay.

This shift impacts transportation cost stability, service-level reliability, cold-chain integrity, and network resilience. In volatile freight environments, variance control is more financially significant than marginal distance savings.

Test ETA Variance Control in 14 Days

No replacement of your TMS | No disruption to current workflows | No integration overhaul

If your logistics team is optimizing routes but still absorbing unpredictable delivery shifts, the missing element may not be routing efficiency. It may be predictive signal intelligence.

The SpectraONE 14-Day KPI Challenge enables you to select one KPI (ETA Accuracy, Expedite Rate, OTIF), analyze real shipment data in a controlled environment, and measure variance visibility improvements.


Select one KPI and run the 14-day evaluation.
Measure whether predictive visibility reduces variability cost.

Safety Stock Bloat in Retail and FMCG: Why Working Capital Is Quietly Expanding

The Structural Shift in Demand Volatility Across North America

Over the past five years, supply chains across North America have entered a structurally volatile environment. Retail sales alone exceed $700 billion per month in the United States (U.S. Census Bureau). At that scale, even small variations in demand patterns have a measurable financial impact.

Simultaneously, food and beverage manufacturers operate in a market comprising more than 42,000 facilities across the U.S. (USDA ERS). These networks are managing shorter product lifecycles, faster promotional cycles, and higher customer expectations.

According to McKinsey, 82% of supply chains report experiencing disruptions linked to trade or geopolitical volatility. These disruptions amplify lead-time uncertainty and demand variability.

In response, most organizations have adopted a defensive posture and increased safety stock. While this reaction feels prudent, it often masks a deeper structural issue.

Why Safety Stock Levels Continue to Rise

A safety stock is designed to protect service levels as variability increases. However, in today’s environment, three structural factors are quietly inflating buffer levels.

1. Delayed Detection of Demand Drift

Traditional planning systems rely on historical variance and periodic recalculation cycles. Demand deviations are recognized only after sufficient historical data accumulates to make the shift statistically visible. 

By the time a deviation is formally recognized, replenishment cycles have already been executed, production completed, and transfers scheduled. The common response in the next cycle is to increase buffer levels to avoid recurrence. This reactive adjustment compounds over time.

2. Node-Level Imbalance in Retail Networks

Retail inventory often appears balanced at an aggregate level. However, imbalance frequently develops at indivRetail inventory often appears balanced at an aggregate level. However, imbalance frequently develops at individual stores, distribution centers, or regional clusters. When demand shifts unevenly across nodes, some locations accumulate excess inventory, others experience stock pressure, and redistribution occurs too late to prevent margin erosion.

Without real-time visibility into node-level drift, organizations compensate by raising overall safety stock, even though the root problem is distribution misalignment rather than total demand insufficiency.

3. Manual Override Amplification

InIn volatile environments, planners often override system-generated forecasts to reduce perceived risk. While overrides are sometimes necessary, they introduce bias into subsequent planning cycles. Over time, overrides become embedded assumptions, forecast variability appears artificially elevated, and safety stock calculations lead to further buffer inflation.

This cycle is rarely reversed once it becomes embedded in the planning process.

The Financial Implications of Safety Stock Bloat

Excess safety stock impacts far more than warehouse space. It directly influences, working capital allocation, inventory carrying costs, markdown exposure, obsolescence risk and sash flow flexibility.

The Institute of Business Forecasting notes that improving forecast accuracy by 10–20% can significantly reduce inventory levels and associated carrying costs. However, improving forecast accuracy alone does not resolve the timing issue that drives buffer inflation. The critical factor is not only accuracy, but also signal timing.

How SpectraONE Reduces Safety Stock Without Increasing Stockout Risk

How SpectraONE Reduces Safety Stock Without Increasing Stockout Risk

SpectraONE does not replace ERP, forecasting, or replenishment systems. Instead, it introduces a real-time signal intelligence layer that enhances the timing and quality of operational insight. The measurable difference lies in how volatility is detected and interpreted.

Early Drift Detection Before Variance Becomes Structural

SpectraONE applies transformer-based pattern recognition and contextual reasoning to structured operational data. Rather than waiting for deviations to accumulate across planning cycles, it identifies unusual drift as it begins to form. 

This earlier detection allows teams to adjust replenishment before the imbalance widens, reallocate inventory before shortages intensify, and modify procurement plans before excess builds. By acting sooner, organizations reduce the need to increase safety stock defensively.

Node-Level Visibility Across Retail and FMCG Networks

In retail and FMCG environments, performance distortion rarely appears uniformly. SpectraONE surfaces node-level variations in demand and supply, enabling planners to understand where imbalances are developing. 

Instead of raising network-wide buffers, teams can target specific nodes for redistribution, protect high-risk clusters without inflating global stock, and maintain service levels with lower overall inventory exposure. This precision reduces working capital strain while maintaining customer satisfaction.

Scenario Simulation Before Buffer Expansion

SSafety stock increases are often implemented without structured scenario evaluation. SpectraONE enables operational teams to simulate sustained demand drift, lead-time normalization, promotion extension effects, and supply-side variability. 

Rather than adjusting buffers based on uncertainty, planners can test potential outcomes before committing capital.

Reducing Manual Override Dependency Through Explainable Insight

SpectraONE provides contextual explanations behind detected anomalies. By identifying likely drivers such as regional lift patterns or correlated supply shifts, planners gain greater confidence in system-generated insight. Improved trust reduces unnecessary overrides, which in turn stabilizes future safety stock calculations.

What Changes Operationally After Implementation

Organizations implementing SpectraONE typically observe:

  • Reduced reactive buffer adjustments
  • Clearer node-level visibility
  • Improved alignment between forecasting and replenishment
  • Greater confidence in lowering safety stock in stable clusters

The transformation is not abstract; it is operational. Safety stock becomes a deliberate decision variable rather than a reflexive protection mechanism.

Moving From Buffer Management to Signal Management

The fundamental shift in modern supply chain planning is not eliminating safety stock. It is managing it intelligently.

This distinction directly impacts margin, working capital, and inventory turns.

Test the Impact Before You Commit

If safety stock has steadily increased in your organization over the past several years, the most important question is not whether volatility exists. It is whether your systems detect that volatility early enough to avoid defensive over-buffering.

The SpectraONE 14-Day KPI Challenge enables you to select one KPI (Inventory Turns, Forecast Accuracy, Stockout Rate), run a structured 14-day signal analysis, and measure whether earlier visibility reduces buffer dependence.


No system replacement | No integration risk | No workflow disruption.

Choose one KPI and test it for 14 days.
Measure the operational difference before scaling.